I wanted to share my findings on two popular trading tool options: TradingView and StockCharts.com. As someone who spends a lot of time analyzing financial markets, I’ve found these tools to be invaluable for technical analysis and trading decisions.
My experience shows that TradingView is notable for its substantial user base of 20 million active traders and investors globally, which provides comprehensive charting tools for international markets. Conversely, StockCharts.com is more concentrated on US markets and offers detailed expert analysis, which many traders highly value. I will examine the principal features and distinctions between these platforms to assist you in determining the most suitable one for your requirements.
My Verdict
Based on the 23 factors I tested head-to-head, TradingView beats StockCharts.com in nearly every feature, including chartings, screening, and community.
TradingView stands out for its trading features, social community, news integration, backtesting capabilities, and stock screening tools. Its overall rating is 4.7/5, compared to StockCharts’ 3.8/5. StockCharts has made strides with its new ACP charting platform, but it still trails TradingView in flexibility and global market coverage.
Features Compared
Both platforms provide excellent charting capabilities with various chart types, such as candlestick, bar, and line charts. They also include a wide range of technical indicators and drawing tools to analyze price movements. TradingView stands out with its global market coverage and social features. I can share my chart ideas and interact with millions of other traders.
| Category | TradingView | StockCharts |
|---|---|---|
| ⚡ Key Tools | Charts, News, Watchlists, Screeners | Charts, Watchlists, Screeners |
| 🏆 Standout Features | Trading, Strategy Backtesting, Social Network | User Commentary |
| 🎯 Ideal For | Traders in Stocks, Forex, & Crypto | Stock Market Enthusiasts |
| ♲ Plans Available | Monthly and Annual Options | Monthly and Annual Options |
| 💰 Cost | Free to $59/month | Free to $39/month |
| 💻 Platform | Accessible via Web Browser | Accessible via Web Browser |
| 🎮 Free Trial | 30-Day Free Access | 30-Day Free Access |
| 🌎 Coverage | Worldwide | USA, UK, and Canada |
| ✂ Special Offers | $15 Off + Free 30-Day Premium Access | 8% Savings on Annual Plan |
| 🏢 Explore | Check Out TradingView | Explore StockCharts |
TradingView offers:
- Real-time data for stocks, forex, and crypto globally
- Custom indicators with Pine Script
- Broker integration for direct trading
- Mobile app for on-the-go analysis
StockCharts focuses on US markets and excels in:
- Extensive historical data
- Advanced scanning tools
- Customizable chart layouts
- Candleglance styles for quick market overviews
My Ratings
TradingView earns a solid 4.7/5 rating, excelling in community engagement, charting tools, backtesting, news coverage, and stock screening. StockCharts trails with a 3.8/5 rating, lacking in social features, financial news, and backtesting options. While StockCharts’ new ACP platform is a step up, it still can’t match TradingView’s wide range of charts, indicators, and drawing tools. StockCharts does offer expert market commentary, but TradingView’s huge community of 20 million users sharing ideas is hard to beat.
| Feature | TradingView 4.7/5 | StockCharts 3.8/5 |
|---|---|---|
| Pricing | ★★★★★ | ★★★★☆ |
| Software | ★★★★★ | ★★★★☆ |
| Trading | ★★★★☆ | ★★★☆☆ |
| Scanning | ★★★★☆ | ★★★★☆ |
| News & Social | ★★★★★ | ★★☆☆☆ |
| Backtesting | ★★★★☆ | ★★☆☆☆ |
Charts
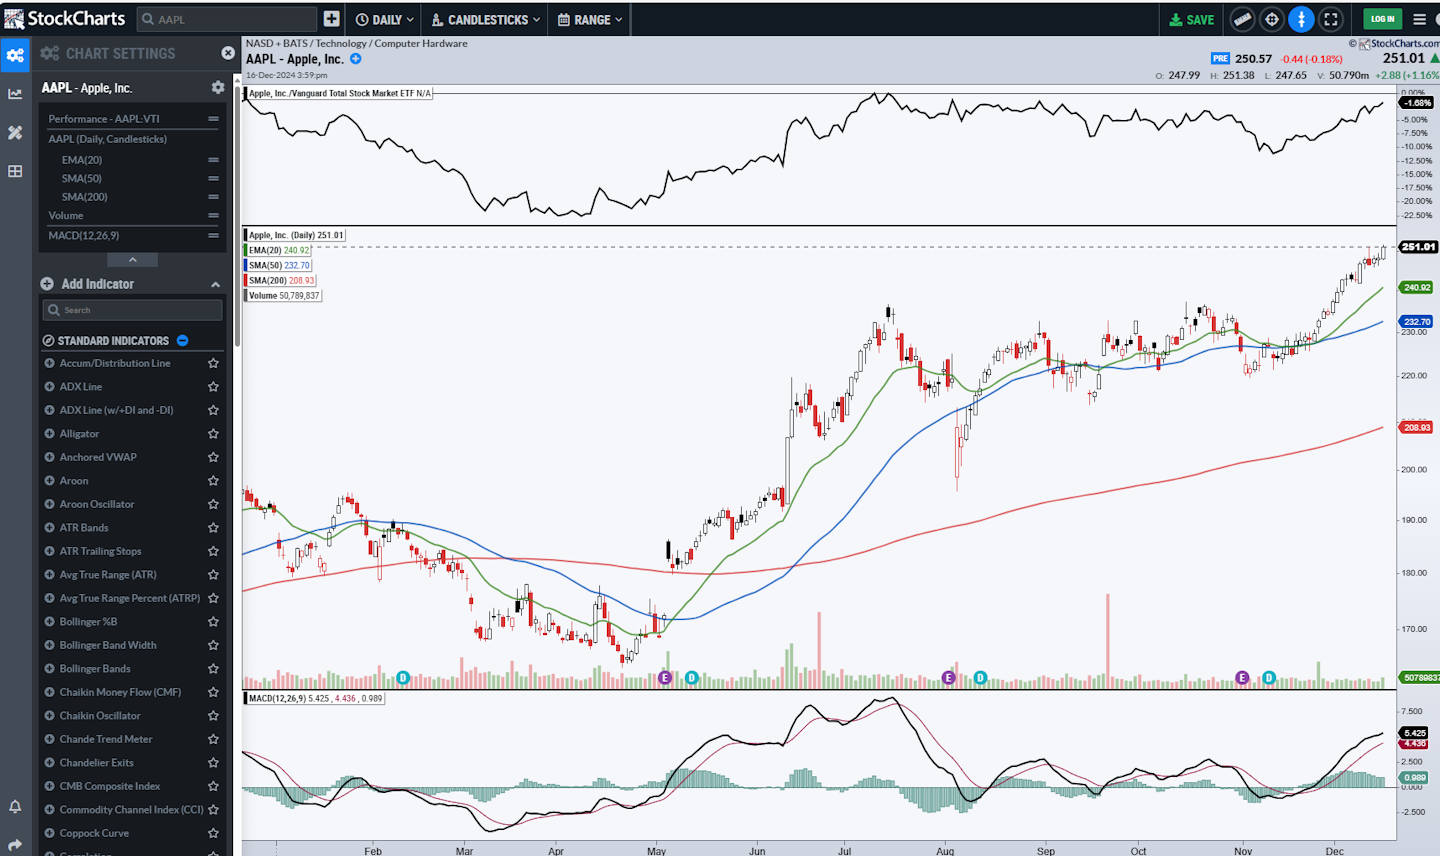
TradingView and StockCharts are the two top platforms for chart analysis. I’ve found that TradingView offers more options with 160 indicators than StockCharts’ 66. TradingView also has 12 chart types, including some unique ones like LineBreak and Kagi. StockCharts matches this with 12 types, too, featuring the Elder Impulse system.
TradingView and StockCharts are the two top platforms for chart analysis. I’ve found that TradingView offers more options with 160 indicators than StockCharts’ 66. TradingView also has 12 chart types, including some unique ones like LineBreak and Kagi. StockCharts matches this with 12 types, too, featuring the Elder Impulse system.

TradingView wins with 65 tools for drawing on charts. It has special Gann and Fibonacci tools, plus lots of icons for notes. StockCharts has 32 tools, which is still quite good.
StockCharts has improved with its new advanced charting platform (ACP). It’s better than before, but I think TradingView’s charts are still more flexible and powerful.
I really like TradingView’s Buy and Sell gauges. They quickly show if a stock looks good to buy or sell. StockCharts doesn’t have this feature.
TradingView also has great stock indicator ratings. They use two key types of indicators: moving averages and oscillators. I’ve noticed these ratings are pretty good at showing market mood.

While TradingView has more features, StockCharts’ ACP is still a solid choice. Both platforms are useful for chart analysis, but TradingView seems to have an edge in terms of tools and features.
Pattern Recognition
I’ve found that TradingView offers the most powerful pattern recognition. StockCharts lets paying members scan for point, figure, and candlestick patterns. TradingView’s free service includes automated candlestick recognition for 80+ different patterns. Additionally, I’m impressed by TradingView’s thousands of community-developed indicators and systems. Find out more in the full TradingView review.
Platform
TradingView and StockCharts are top-notch charting tools for traders and investors. Both platforms offer cloud-based HTML5 software, eliminating the need for downloads or installations. They work seamlessly across devices, providing a smooth user experience.
TradingView stands out with its global market coverage, including stocks, futures, forex, and crypto. It also boasts a social community and backtesting features. StockCharts focuses mainly on US markets and stocks.
Here’s a quick comparison:
| Feature | TradingView | StockCharts |
|---|---|---|
| Powerful Charts | ✅ | ✅ |
| Stocks | ✅ | ✅ |
| Futures | ✅ | ❌ |
| Forex | ✅ | ❌ |
| Cryptocurrency | ✅ | ✅ |
| Screeners | ✅ | ✅ |
| Market Covered | Global | USA |
Both platforms offer strong charting capabilities and stock analysis tools, making them solid choices for traders.
Live Trading
I’ve found that TradingView stands out in terms of its broker integration. It works with 30 quality brokers, letting me trade right from the charts. I can see my profits and losses in real-time. StockCharts pairs with Tradier, offering $0 commission stock trades. For options, there’s a $25 monthly fee.
TradingView also connects with TradeStation, a broker that offers zero-commission stock trades. I can use TradingView for futures, forex, and crypto trading, too. These tools make it easier for me to manage my trades and track my performance.
TradingView gets my top rating! It’s hands down the best trading software out there, offering built-in broker integration, powerful backtesting tools, advanced scanners, and access to the world’s largest trading community. It’s a game-changer for traders at all levels!
Screening
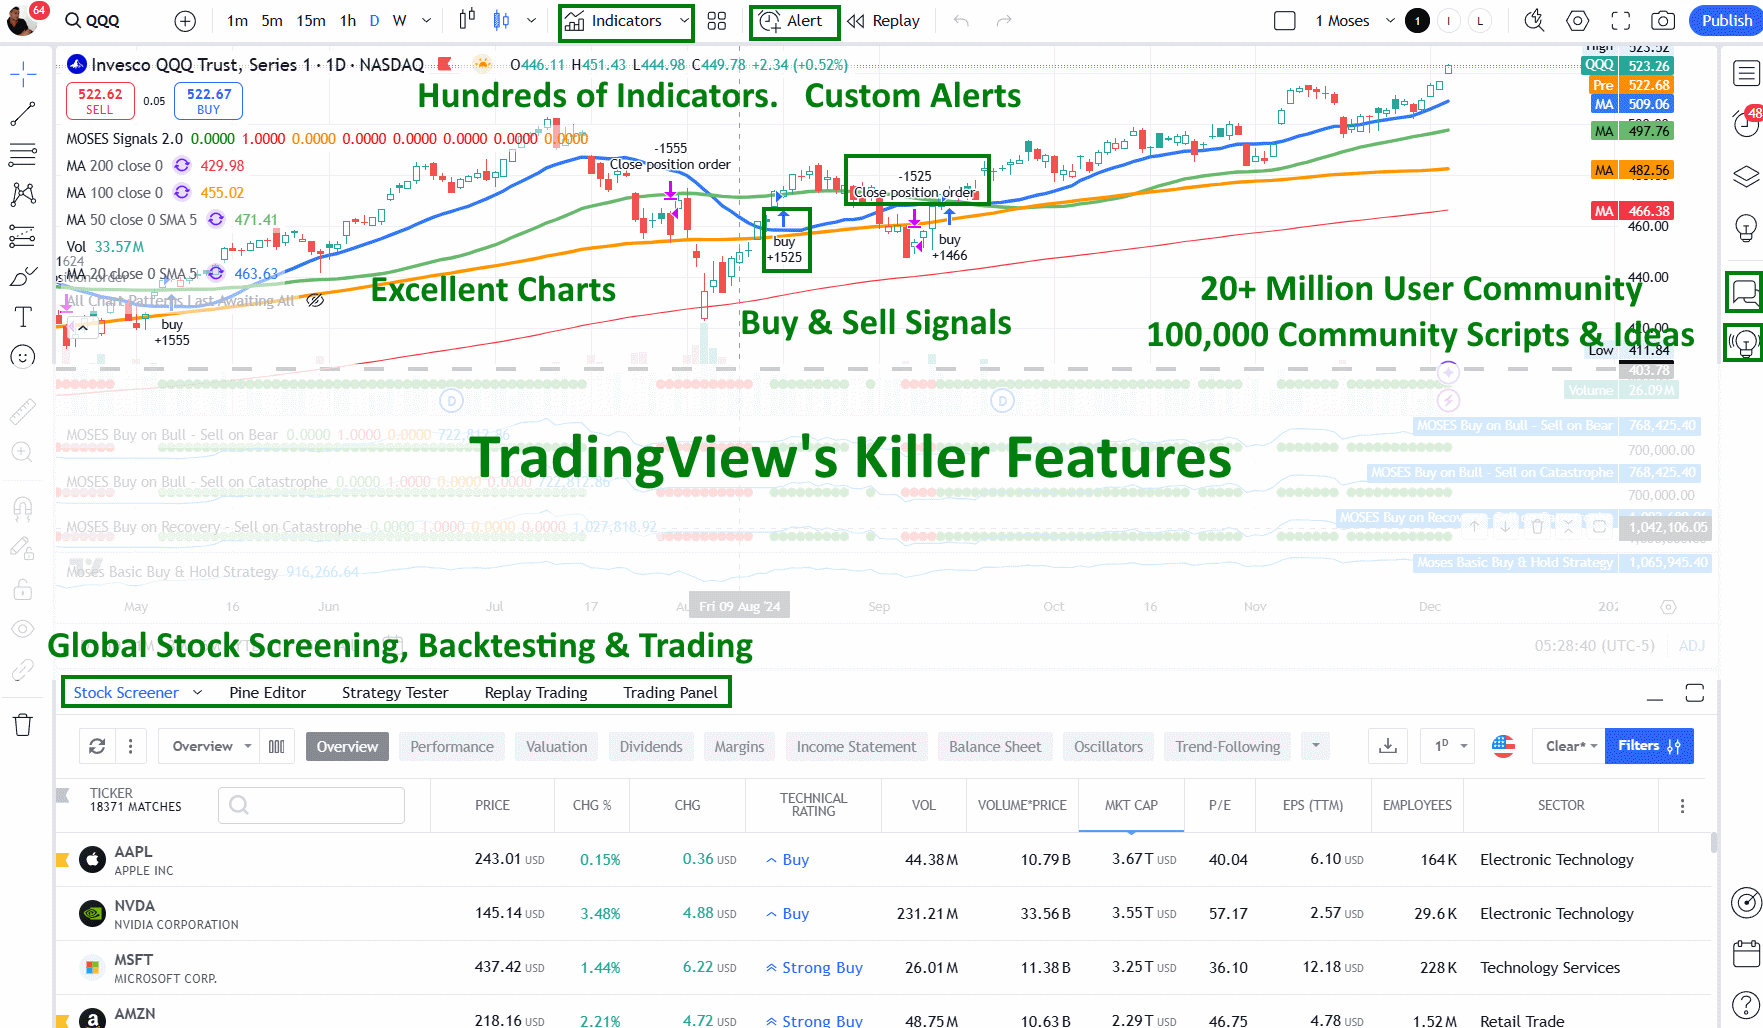
Stock screening is a powerful tool I use to find trading opportunities. TradingView offers a comprehensive screener with 160 criteria, covering both fundamental and technical analysis. I can filter stocks based on common metrics like EPS and PE ratio, as well as more unique factors such as employee count and goodwill.
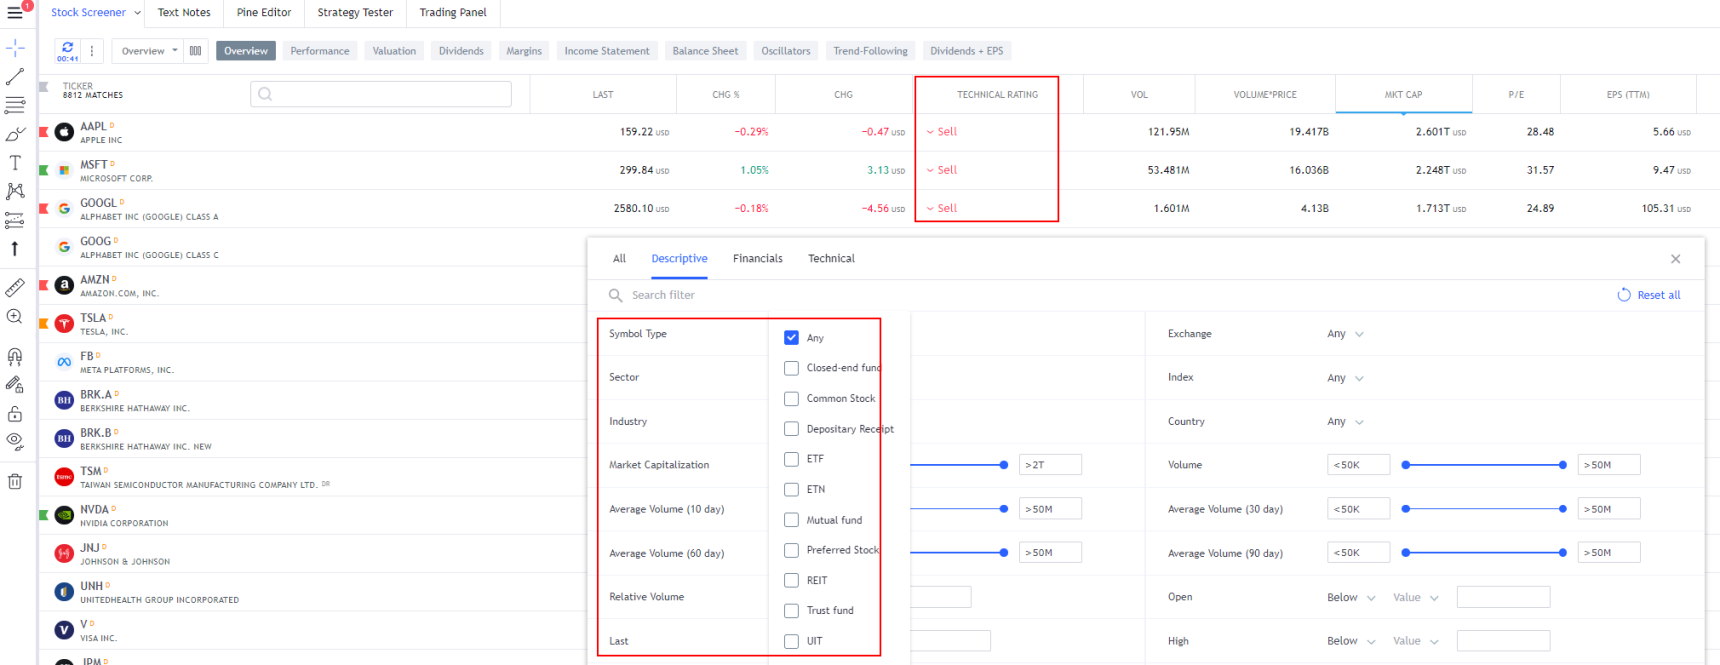
StockCharts focuses more on technical screening. Its advanced scan workbench lets me use popular indicators like MACD and RSI. While it has a coding window for custom scans, I find TradingView’s Pine script more flexible.
Both platforms have their strengths. TradingView’s screener is more versatile, allowing me to scan stocks, forex, and crypto markets. It also includes heatmaps, which I find helpful for quick market analysis. StockCharts excels in technical screening, especially for price patterns in candlestick and point-and-figure charts.
Heatmaps
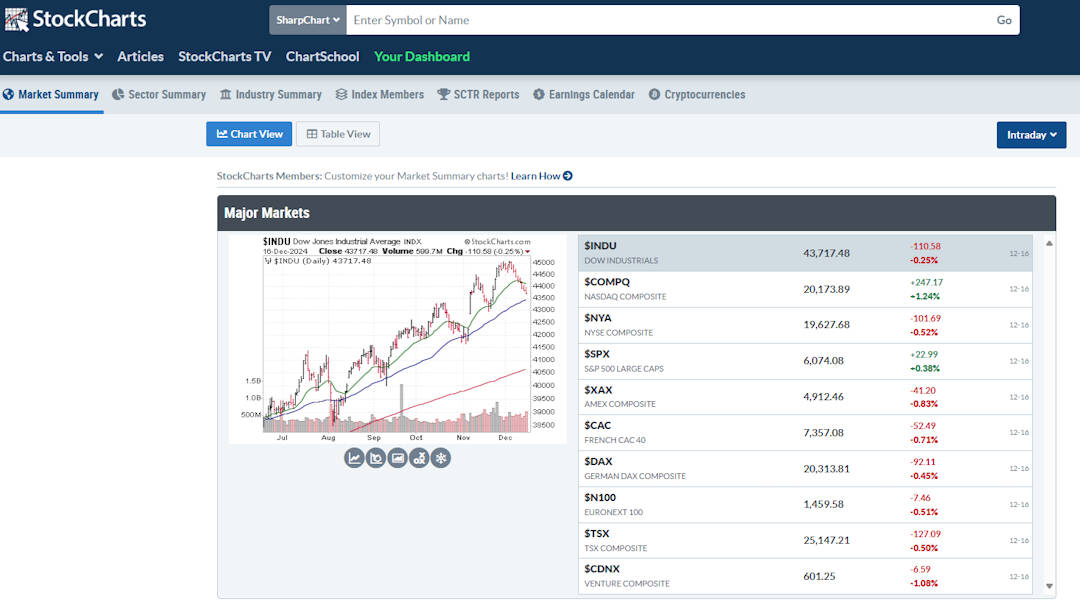
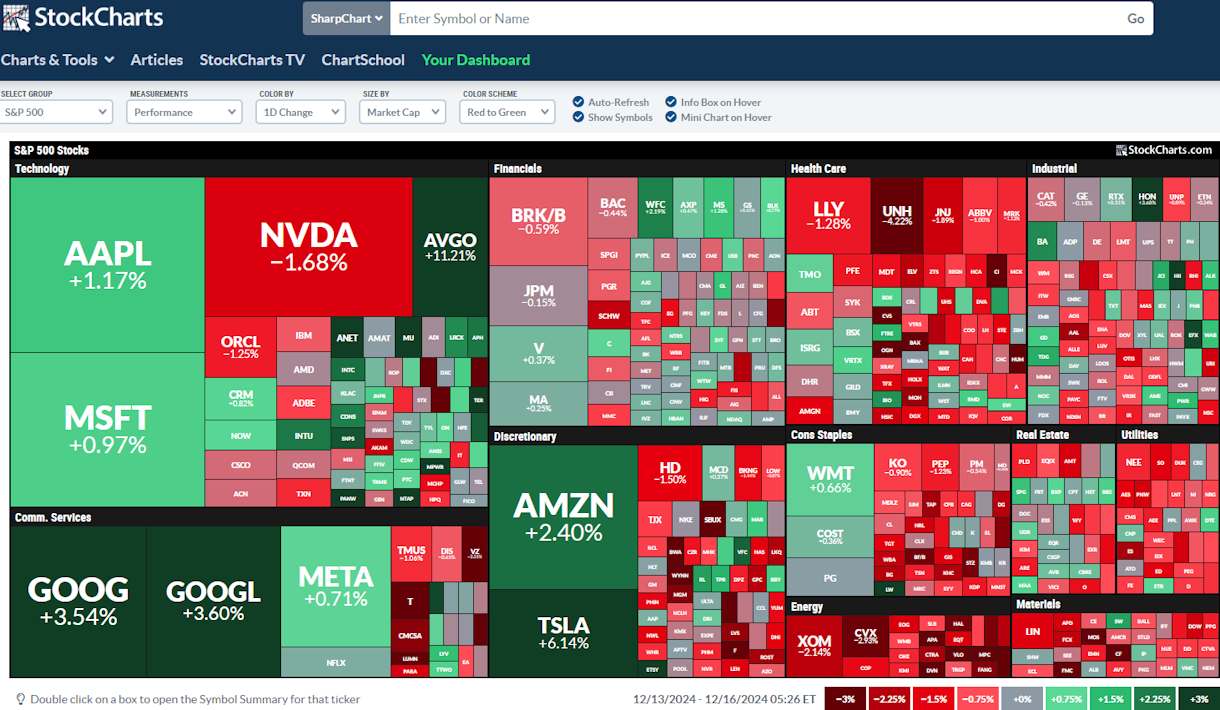
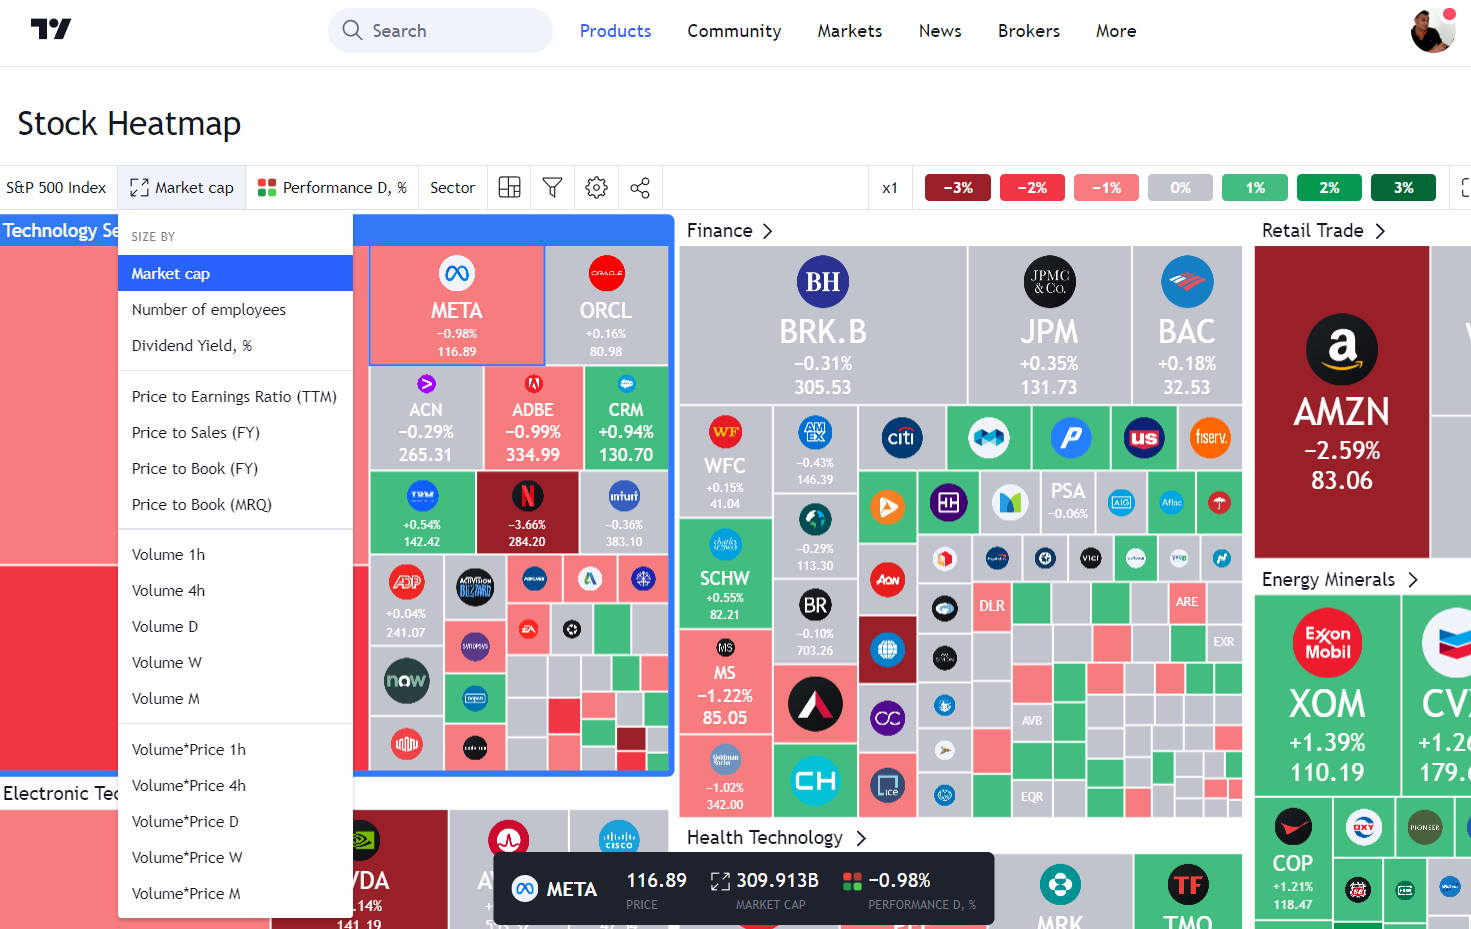
TradingView’s heatmaps are highly configurable and visually appealing, while the heatmaps from StockCharts.com’s market carpets are quite basic.
When it comes to analyzing the market, having access to visual data can greatly enhance one’s decision-making process. That’s where heatmaps come in—they provide a quick overview of price movements, volume changes, and other key market data. But when it comes to choosing between two popular heatmap options—TradingView and StockCharts.co—should I choose TradingView?
News & Social
TradingView is a hub for traders and investors to connect and share ideas. I love using its chat forum to discuss market trends with other users. The publishing system lets me post my charts and analysis for others to see. It’s a great way to learn from experienced traders.
TradingView has a big community of over 20 million users. I find it much better than StockTwits for social trading. The newsfeed keeps me up to date on market events.
I share my own stock market ideas and commentary on TradingView. You can check out my published ideas and follow me there. I’d love to connect with you on the platform!
Backtesting
TradingView really shines when it comes to backtesting. Their Strategy Tester is a powerful tool that lets you test trading ideas using historical data. It shows you important stats like profits, losses, and drawdowns.
StockCharts, on the other hand, doesn’t offer true backtesting. You can scan for patterns in past data, but that’s not the same as running a full strategy test.
What I love about TradingView is how user-friendly it is. Even though you need to use their Pine Script language to create custom strategies, it’s pretty easy to pick up. I’m no coding expert, but I implemented my own ETF trading strategy using their system.
Here’s an example of what a backtested strategy looks like in TradingView:
TradingView vs. StockCharts: TradingView has implemented an innovative automatic technical analysis rating system

Pricing
TradingView offers several pricing tiers to fit different needs. The basic plan is free and ad-supported, giving users access to essential features. For those wanting more, the Pro plan costs $14.95 monthly, Pro+ is $29.95, and Premium is $59.95. I’ve found that choosing a yearly subscription can save you 16%, which is a nice bonus.
If you need real-time data, TradingView charges $2/mo per exchange. In my experience, the Pro plan strikes a good balance between features and cost, offering more advanced tools without breaking the bank.
StockCharts’ plans start at $15 monthly for Basic, $25 for Extra, and $40 for Pro. They offer an 8% discount and one free month with yearly subscriptions. Real-time data costs an extra $10 monthly, which is pricier than TradingView’s $2 fee.
While both have free options, TradingView’s free plan offers more features. These include scanning, screening, backtesting, watchlists, and candlestick chart recognition. With StockCharts, you’d need to pay for these perks.
Final Thoughts
TradingView stands out as the top choice for stock analysis and trading software. It’s great for both new and experienced traders, featuring a vibrant community and awesome tools for charting, backtesting, scanning, and screening across global markets. While StockCharts has its strengths, TradingView matches or surpasses it in every category.
Other Head-to-Head Tools Comparisons & Tests
- Finviz vs. Stock Rover: Comparing Top Stock Screening Tools.
- TradingView vs. TC2000: 32 Features Tested & Rated
- Finviz vs TradingView: Which One Makes You a Better Trader?
- TradingView vs StockCharts: My Test Results Will Shock You.
- TradingView vs. TrendSpider: 68 Point Test Decides The Best
- Read the full TradingView Review.
- Read the in-depth TC2000 review.
- Check out the Finviz Review.
- Real-time news and advanced charting: MetaStock
- The Ultimate AI Trading Platform: TrendSpider
- AI-powered day trading: Trade Ideas
FAQ
Is TradingView or StockCharts better for stock trading?
I’d say TradingView has the edge for stock trading. It integrates with over 50 brokers worldwide, a feature StockCharts lacks. This integration makes executing trades directly from the platform much more convenient.
Is StockCharts better at pattern recognition than TradingView?
In my experience, TradingView outperforms StockCharts in pattern recognition. It can detect and scan for 36 candlestick patterns and more than 25 profitable chart patterns, including double bottoms and head and shoulders formations.
Which is easier to use, StockCharts or TradingView?
Both platforms have intuitive designs, but I find TradingView more responsive and comprehensive in its coverage of assets and markets. StockCharts is simpler but more basic in its functionality.
What is the big difference between TradingView and StockCharts?
The main distinction I’ve noticed is that TradingView offers more features, like interactive charts and strategy backtesting. StockCharts focuses more on basic charting functions and covers a narrower range of assets and markets.
Does Tradingview cover more global markets than Stockcharts?
Yes, TradingView’s global coverage is much broader. It provides access to over 30 stock, currency, and crypto exchanges worldwide, including markets in the US, UK, Canada, Germany, Australia, and India. StockCharts primarily focuses on US stocks.

