As an active trader and technical analyst, I’ve extensively tested and used both TradingView and Finviz. These two platforms are popular choices for stock screening and charting. TradingView stands out with its advanced charting tools, pattern recognition features, and vibrant community of traders sharing ideas. It also provides data for global exchanges, giving it an edge for international investors.
Finviz also has some advantages. Its index backtesting capabilities are more robust, allowing traders to test strategies across entire market sectors. The pattern scanning tool in Finviz is also quite powerful for quickly identifying potential trade setups. Both platforms have their strengths, but in my experience, TradingView offers a more comprehensive package for most traders and investors.
Winner: Finviz vs. Tradingview
My detailed testing shows that TradingView beats Finviz in nearly every category, including pricing, trading, analysis, charts, indicators, screening, and pattern recognition.
Here’s a breakdown of how they stack up:
| Feature | TradingView | Finviz |
|---|---|---|
| Overall Rating | 4.7/5.0 | 4.0/5.0 |
| Pricing | ★★★★★ | ★★★★★ |
| Software | ★★★★★ | ★★★★☆ |
| Trading | ★★★★★ | ★★☆☆☆ |
| Scanning | ★★★★☆ | ★★★★☆ |
| Pattern Recognition | ★★★★☆ | ★★★★☆ |
| Newsfeed | ★★★★☆ | ★★★★☆ |
| Social | ★★★★★ | ★☆☆☆☆ |
| Chart Analysis | ★★★★★ | ★★★☆☆ |
| Backtesting | ★★★★☆ | ★★★★☆ |
| Usability | ★★★★★ | ★★★★☆ |
| Customer Support | ★★★☆☆ | ★★★☆☆ |
| Try it! | Try TradingView for Free | Try Finviz for Free |
TradingView excels at charting, trading, and social features. Its user-friendly platform makes it easy to analyze charts and execute trades. The strong community adds value through shared ideas and strategies.
Finviz holds its own in scanning and pattern recognition. It’s a solid choice for fundamental screening and tracking insider trading. Both platforms offer good newsfeed options to keep users informed.
They’re on par in pricing, but TradingView’s extra features give it an edge in value for money. Its software is more advanced, which shows in the higher usability rating.
TradingView gets my top rating! It’s hands down the best trading software out there, offering built-in broker integration, powerful backtesting tools, advanced scanners, and access to the world’s largest trading community. It’s a game-changer for traders at all levels!
Finviz vs. TradingView Overview
I’ve compared Finviz and TradingView, two popular trading platforms. TradingView stands out with a score of 4.7/5.0, offering robust features across the board. Finviz scores 4.0/5.0, excelling in quick stock market data visualization but lacking in some areas.
Key shared features:
- Charts and pattern recognition
- Scanning tools
- Heat maps
TradingView boasts:
- Global community
- Comprehensive data
- Strong cryptocurrency support
Finviz shines with:
- Rapid data visualization
- User-friendly interface
- Focus on US markets
TradingView’s community is great for trading ideas. Its superior charting tools make it ideal for technical analysis. Finviz’s strength lies in its quick overview of market trends, which is perfect for spotting potential opportunities at a glance.
Benefits
TradingView and Finviz offer a range of benefits for traders and investors. TradingView’s charting tools are more advanced, with customizable indicators and the ability to create custom scripts using Pine Script. It’s great for technical analysis, allowing me to plot hundreds of indicators, such as moving averages, RSI, CCI, MACD, and many more.
Finviz excels in stock screening and visualization. Its stock screener filters stocks based on financial and technical criteria, such as P/E ratio, market cap, and sector. The heat maps are a visual treat, giving me a quick overview of market trends.
Both platforms provide fundamental metrics, but I noticed Finviz puts more emphasis on this area. It displays key financial ratios and company data in an easy-to-read format.
TradingView is better for volume analysis. Its charts show volume bars and offer volume profile indicators, which I find helpful for identifying support and resistance levels.
TradingView’s social features set it apart. I can share my charts and ideas with a large community of traders. This isn’t something Finviz offers.
While both cover US stocks, TradingView goes further with global forex, futures, and cryptocurrency markets. This makes it more versatile for traders interested in multiple asset classes.
Pricing
TradingView and Finviz offer competitive pricing options for their stock analysis tools. I’ve found that TradingView’s pricing structure is quite flexible, starting with a free basic plan and moving up to paid tiers. The Pro plan costs $14.95 monthly, Pro+ is $29.95, and Premium is $59.95. Yearly TradingView subscriptions can save you 16%, which is a nice bonus. If you need real-time data, there’s a $2 fee per exchange.
Finviz takes a different approach. They have a solid free plan that many users find sufficient. For those wanting more, the Elite service is priced at $39.99 per month. You can save 37% by choosing the annual plan at $24.96 monthly.
TradingView Discounts
I’ve discovered a way to get up to 70% off TradingView subscriptions during Black Friday. This is a significant saving that can make their premium features much more accessible. Check out the detailed guide on TradingView Black Friday discounts to learn the steps.
Finviz Coupon Code
While Finviz doesn’t offer coupon codes, it does have a deal for new Elite subscribers. You can get a 37% Finviz discount on a one-year subscription. It’s a great way to try out its advanced features at a lower cost. Just remember that this offer is for new customers starting an Elite plan.
Live Trading
My testing shows TradingView to be the superior platform for stock trading compared to Finviz. With TradingView, I can trade directly from charts using its full broker integration with 27 high-quality brokers. This tight integration lets me view my profits and losses right in TradingView. Finviz lacks broker integration, so I have to manually enter trades with my current broker. For active traders and day traders seeking efficient execution, TradingView’s seamless integration is a clear advantage.
Screening
While both TradingView and Finviz offer excellent scanning and screening, TradingView wins this head-to-head battle due to its breadth of criteria and global market coverage.
TradingView Screening & Scanning
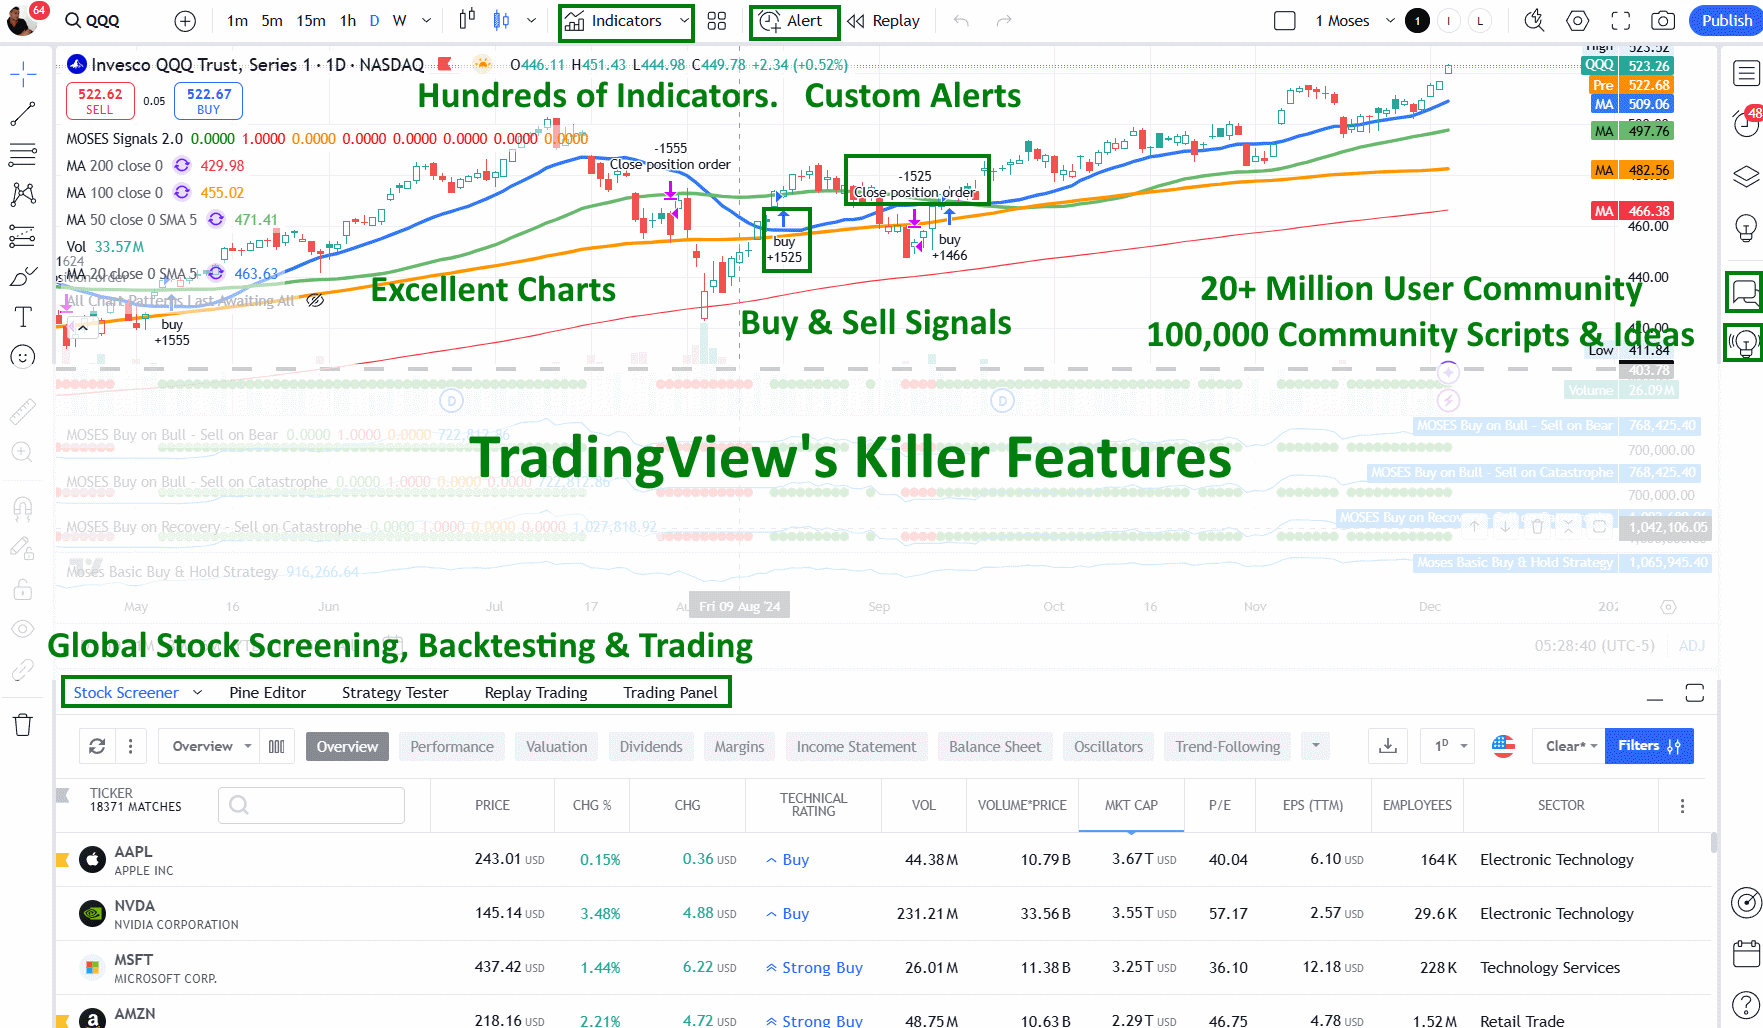
TradingView’s stock screening abilities are tremendous. With over 168 criteria to choose from, it offers a comprehensive toolkit for analyzing stocks, forex, and cryptocurrencies. The platform’s integrated screeners and heatmaps cover both fundamental analysis and price/volume indicator scanning.
What sets TradingView apart is its screening options. Beyond EPS and PE ratios, it delves into more nuanced criteria such as employee count and goodwill. This level of detail allows for very customized screens tailored to specific investment strategies.

The interface is user-friendly, making it easy to set up and run complex scans. I appreciate how quickly I can filter through vast amounts of market data to find stocks that meet my exact criteria. Whether I’m looking for value plays or momentum stocks, TradingView’s screener has proven to be a reliable tool in my investment arsenal.
Finviz Screening & Scanning
Finviz has long been a go-to platform for stock screening, and for good reason. Its screener is very fast, allowing me to filter through 8,500+ major stocks and ETFs in seconds. While it doesn’t cover every stock in existence, it focuses on the most significant players in the market.
With 67 fundamental and technical criteria, Finviz offers a solid range of filtering options. What I find particularly useful is its ability to screen for specific chart-based signals. I can quickly identify stocks hitting new highs or lows, those that are oversold, or ones with recent analyst upgrades or insider buying activity.
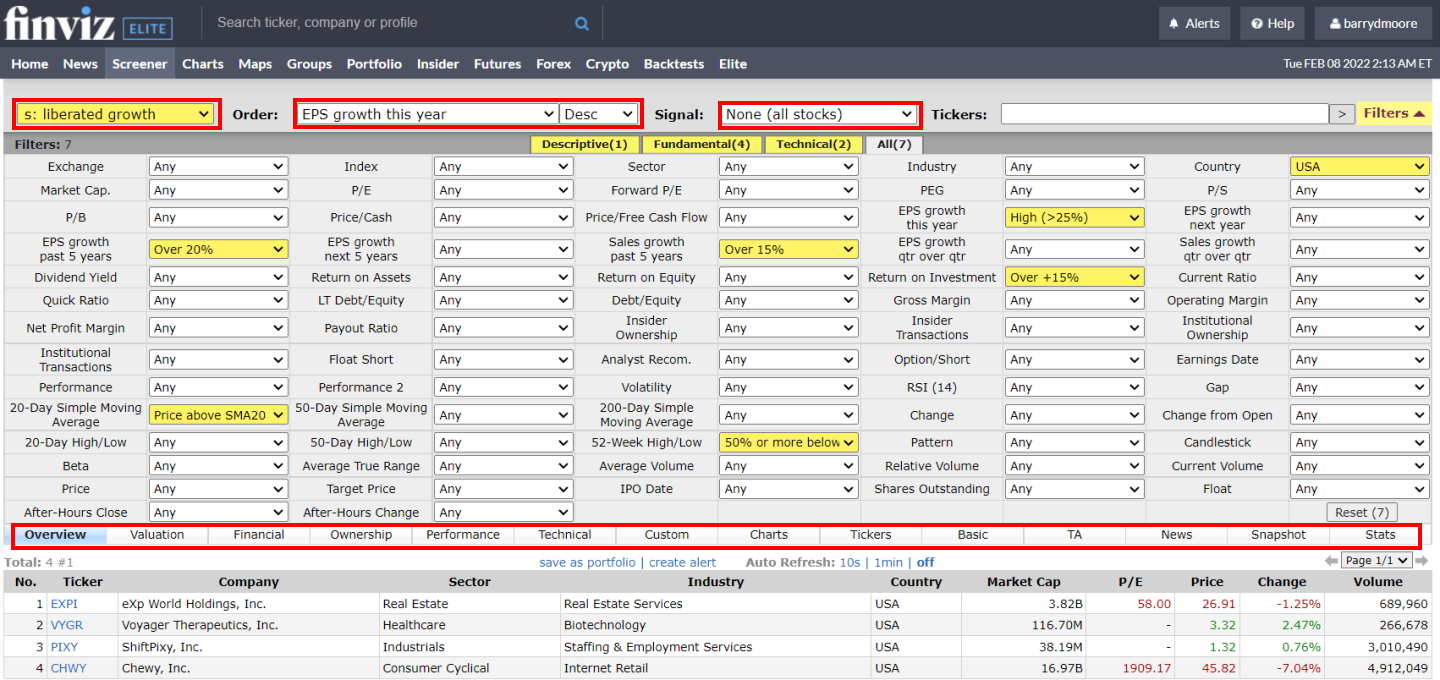
One of Finviz’s standout features is its chart pattern recognition. I can screen for ten major candlestick patterns and 30 stock chart patterns, which is quite helpful for technical analysis. This blend of fundamental criteria, technical indicators, and pattern recognition makes Finviz a universal tool for different trading styles.
I find Finviz particularly suitable for short-term and medium-term investing strategies. Its mix of data points allows me to quickly spot potential opportunities across different time frames and trading approaches.
Pattern Recognition
Chart pattern recognition is important for traders and investors. Platforms like Finviz and TradingView offer great features in this area. TradingView scans for more patterns than Finviz, with a huge selection of recognized candlesticks and price patterns.
Finviz stands out with its automatic trendline detection, spotting patterns like wedges and double tops on daily charts. It also has 33 built-in stock chart signals.
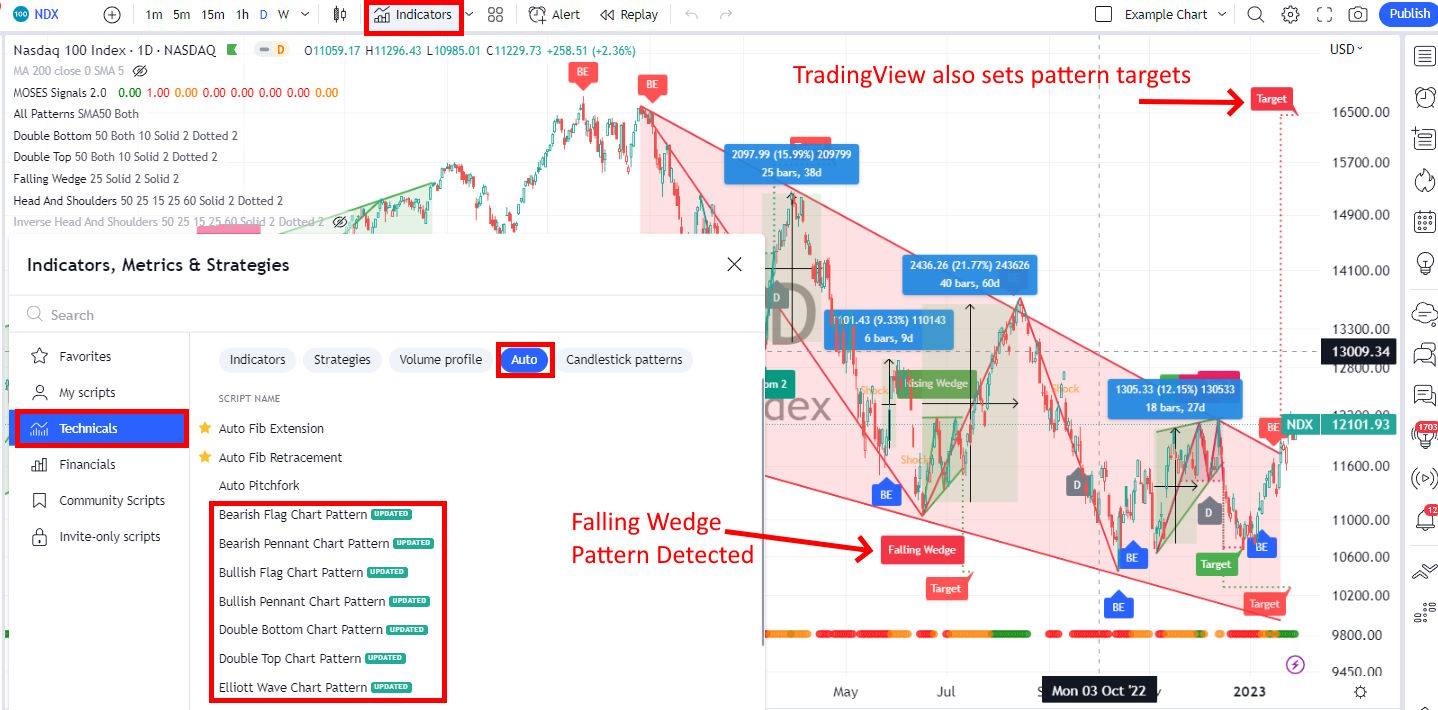
TradingView impresses me with its automated candlestick pattern recognition and tons of community-created indicators. For those wanting top-notch AI-powered pattern recognition, I recommend checking out Trade Ideas, TrendSpider, or Tickeron.
News & Community
TradingView is the go-to platform for social trading and community engagement. Its integrated chat forum and publishing system are perfect for sharing charts and ideas with other traders. With over 20 million users, it’s a great platform for market insights and investment discussions.
I use TradingView to publish my stock market analysis and commentary. The platform lets me connect with fellow traders, exchange thoughts, and learn from others’ strategies. It’s a great place to stay on top of market trends and get real-time feedback on trading ideas.
For financial news, both TradingView and Finviz offer solid options. They gather news from major sources, keeping users informed about market events. Finviz stands out with its detailed reports on insider trading, showing when company executives buy or sell stocks and options. This can be helpful info for making investment choices.
Chart Analysis
While both TradingView and Finviz offer charts, TradingView’s charting is significantly better. It’s flexible and fast and incorporates strategy backtesting and custom indicators in an easy-to-use interface.
TradingView Charting
TradingView’s charting capabilities are top-notch. Their platform offers an impressive array of 160 indicators and unique specialty charts. These include LineBreak, Kagi, Heikin Ashi, Point & Figure, and Renko charts, which give traders a variety of ways to analyze market data.
The drawing tools on TradingView are exceptional. With 65 different options and hundreds of icons, I can easily annotate charts and share ideas. The platform’s Gann and Fibonacci tools are quite important, as they’re not commonly found on other platforms.
One feature I really appreciate is TradingView’s Buy and Sell gauges. These handy tools give me a quick snapshot of market sentiment, showing which stocks are bullish, bearish, or neutral. It’s a real-time save when I’m scanning multiple stocks.
TradingView’s stock indicator ratings are well-designed and useful. They focus on two key technical analysis indicators: moving averages (based on price) and oscillators (based on price and volume). I’ve found these ratings to be a good measure of market sentiment, and I even use them in my Fear & Greed Index Dashboard.

Finviz Charting
Finviz’s charting tools leave much to be desired. The platform only offers nine chart overlays, including Bollinger Bands and VWAP, and 17 chart indicators. This limited selection makes for a weak stock charting experience.
I’ve found Finviz’s workflow to be clunky and unintuitive. To add an indicator or study, I can’t simply right-click. Instead, I have to open settings, select the indicators, and then click save. This process feels outdated and slows down my analysis.
A major frustration I’ve encountered with Finviz is the constant need to click “SAVE.” There’s no auto-save feature for screening criteria, chart annotations, or backtests. If I accidentally move to the next chart, I lose my entire configuration. This outdated user experience can be quite annoying.
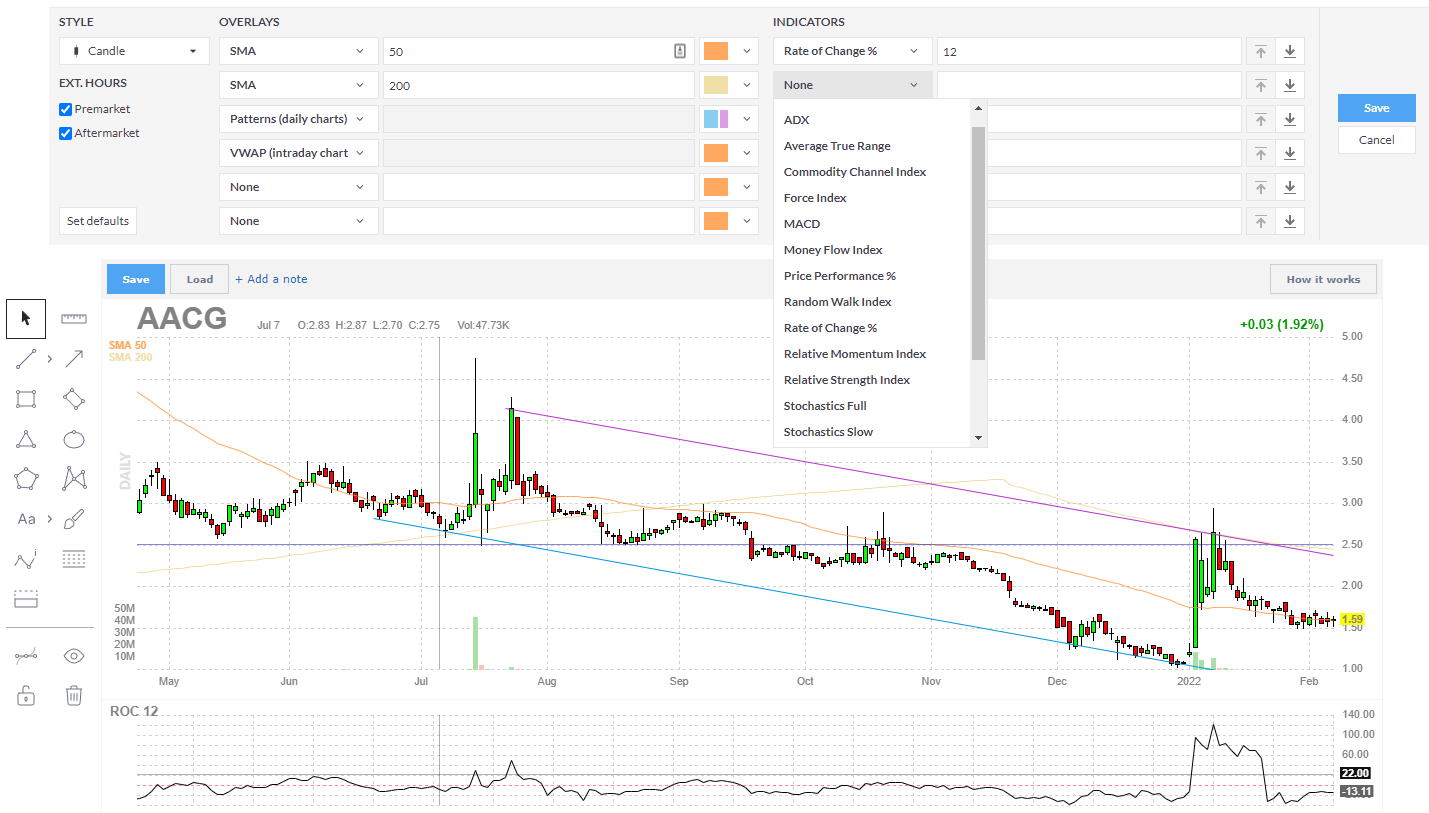
The image above shows Finviz’s basic charting interface. Notice the blue save buttons, which you’ll need to click often to avoid losing your work.
Strategy Backtesting
TradingView Backtesting
TradingView’s Strategy Tester is a powerful tool for backtesting trading systems. I’ve found it offers great flexibility and depth for testing strategies. To use it effectively, you’ll need to learn Pine Script, TradingView’s coding language. Don’t worry if you’re not a programmer – Pine Script is designed to be user-friendly. I’ve successfully implemented complex strategies like the MOSES ETF Trading system using TradingView’s backtesting tools.

The image shows an example of the MOSES ETF strategy implemented in TradingView. The buy and sell signals, along with performance metrics, are clearly marked on the chart. This visual feedback is invaluable for refining your trading strategies.
Finviz Backtesting
Finviz Elite offers a backtesting service, but I’ve found it less impressive than TradingView’s offering. While Finviz provides over 100 indicators and can detect chart patterns automatically, its backtesting tool has some major drawbacks.
I tested a strategy based on the Money Flow Index using Finviz’s backtester. The results looked promising at first glance:
- 1,588% total profit
- 15.24% compounded annual return (CAGR)
- Outperformed the S&P 500’s 10.86% CAGR
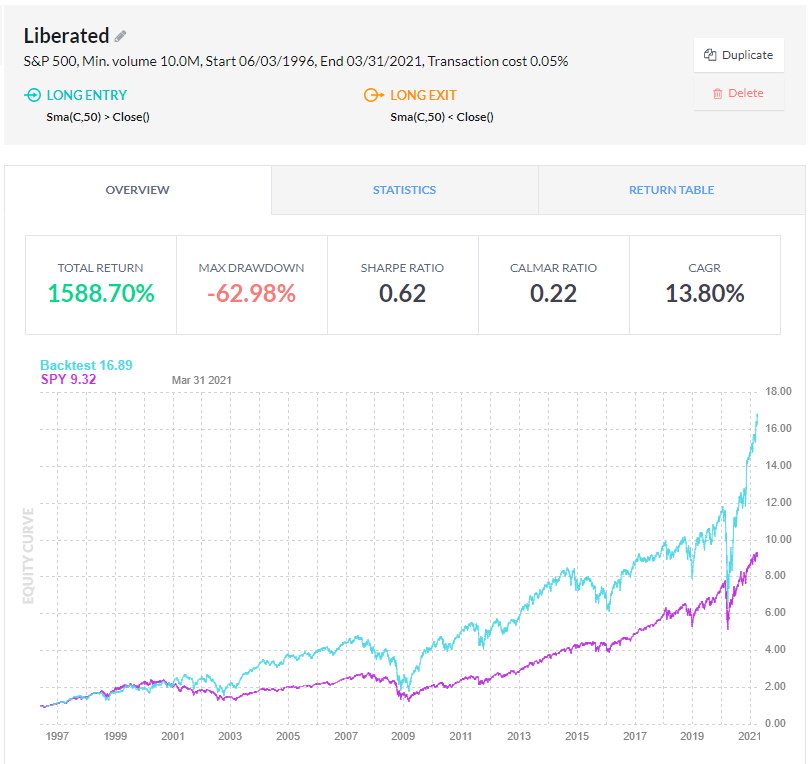
But here’s where Finviz falls short: The reporting is limited. I couldn’t see:
- Individual trade details
- Buy and sell signals
- Maximum drawdown
- Win/loss ratios
Without this crucial information, it’s difficult to trust the backtesting results fully. You cannot verify the strategy’s performance or identify areas for improvement.
In my experience, thorough backtesting requires detailed trade data and performance metrics. Finviz’s lack of comprehensive reporting makes it difficult to rely on for serious strategy development and testing.
Usability
TradingView shines when it comes to usability. Its interface is smooth and intuitive, making it a joy to use. The platform’s design focuses on simplicity, which is great for both beginners and experienced traders.
TradingView’s workflow is seamless. All the tools – charting, screening, and backtesting – work together harmoniously. This integration saves time and makes analysis more efficient.
While easy to use, Finviz feels a bit outdated. Its components don’t mesh as well as TradingView’s. However, Finviz excels at quickly visualizing large amounts of financial data.
Both platforms are web-based, so there’s no need for installation or setup. This is a big plus for users who want to start analyzing stocks right away.
Final Thoughts
My top pick for stock analysis software is TradingView. It caters to traders of all levels and offers excellent charting, backtesting, and screening tools. The vibrant community is a bonus.
For those who need simple, free screening software, Finviz is a solid choice.
If you need real-time news and advanced backtesting, I’d suggest checking out my MetaStock, or Scanz review.. For long-term value and growth portfolios, Stock Rover stands out. And if AI-powered day trading is your focus, Trade Ideas might be the best fit for you.
Other Head-to-Head Tools Comparisons & Tests
- Finviz vs. Stock Rover: Comparing Top Stock Screening Tools.
- TradingView vs. TC2000: 32 Features Tested & Rated
- Finviz vs TradingView: Which One Makes You a Better Trader?
- TradingView vs StockCharts: My Test Results Will Shock You.
- TradingView vs. TrendSpider: 68 Point Test Decides The Best
- Read the full TradingView Review.
- Read the in-depth TC2000 review.
- Check out the Finviz Review.
- Real-time news and advanced charting: MetaStock
- The Ultimate AI Trading Platform: TrendSpider
- AI-powered day trading: Trade Ideas
