I’ve been using TC2000 for 24 years, and I’m excited to share my thoughts on this long-standing platform. It’s been around for over 30 years, which is pretty impressive in the fast-paced world of trading software.
One thing that stands out to me is TC2000’s market scanning tool. It’s incredibly helpful for quickly finding stocks that match my criteria. I can easily set up filters for price and volume, saving me a lot of time.
As a trader, having access to powerful tools like this can make a big difference in my day-to-day work.
Review Scores & Rating
TC2000 gets top marks in many areas. It shines in pricing, software, trading, scanning, charting, and ease of use. These features make it a strong choice for many traders.

TC2000 Rating: 4.3/5.0
| Pricing ★★★★★ | News & Social ★✩✩✩✩ |
| Software ★★★★★ | Charting★★★★★ |
| Trading ★★★★✩ | Pattern Recognition ★✩✩✩✩ |
| Scanning ★★★★★ | Support ★★★★★ |
| Backtesting ★✩✩✩✩ | Usability ★★★★★ |
| Features | Rating ★★★★⯪ |
|---|---|
| Buy/Sell Signals | ❌ |
| Automatic Trade Execution | ❌ |
| Trendline Recognition | ❌ |
| Chart Pattern Recognition | ❌ |
| Candlestick Recognition | ❌ |
| Screening | ✔ |
| Custom Indicators | ✔ |
| Backtesting | ❌ |
| Markets Covered | USA, Canada |
| Assets | Stocks, ETFs |
| Free Plan | ✔ |
| Community & Chat | ❌ |
| OS | Windows |
| Discount Available | $25 Discount Available + 30-Day Premium Trial |
Pros
✔ Easy to use and set up
✔ Awesome US-based help and training
✔ Trade right from the charts
✔ Lots of chart types and indicators
✔ Real-time scanning of the whole market
✔ Excellent Options trading tools
Cons
❌ No pattern recognition
❌ No way to backtest strategies
❌No place to chat with other users

TC2000 falls short in a few key areas: It lacks social features, pattern recognition is missing, and backtesting is absent. Even with these weak points, TC2000 scores 4.3 out of 5 stars in total.
My Verdict
I really like TC2000 for stock trading. It’s got great tools for scanning and charting in real time, and the custom indicators are helpful, too. I’m a fan of how broker-integrated it is, and it lets me trade right from the platform. The options strategy features are a big plus in my book. The only thing I wish it had was backtesting. But overall, it’s a solid choice for US stock and options traders like me.
Top Features
TC2000 has features I really like. The charts and custom indicators are great for analyzing stocks. I find EasyScan helpful and intuitive for quickly finding trade ideas.
One unique thing is TC2000 Brokerage. I can trade stocks and options right on the platform, and if you choose TC2000 Brokerage, you get the entire TC2000 Platinum platform for free.
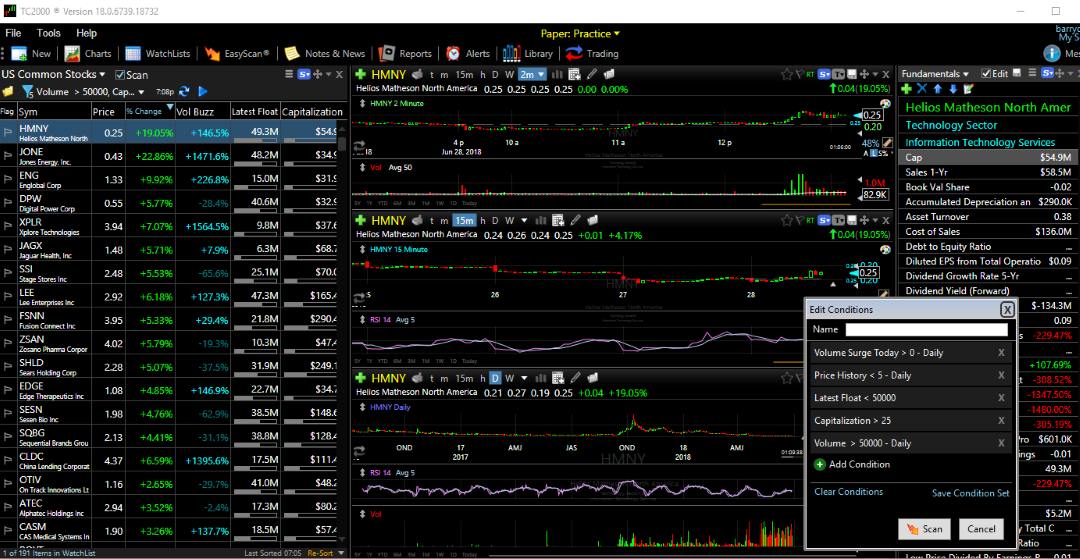
The free version is nice to try out, but the paid plans have way more features.
TC2000 is a powerful tool for stock market analysis. I’ve used it for years and find it super helpful. Worden Brothers Inc. makes it and has won awards for its great features at a low price point. It’s perfect for people who trade stocks, ETFs, and options in the US market.
I love how I can customize TC2000 to fit my needs. It’s flexible and can do a lot, which is why I’ve stuck with it for so long. Whether you’re new to investing or have been doing it for years, TC2000 has something for everyone.
The Competition
I find TC2000 is great for charting, screening, and options trading but falls short on AI trading and pattern recognition. For automated chart analysis and bot trading, I’d pick TrendSpider instead. Stock Rover seems better suited for long-term investors focused on growth, dividends, and value. If you’re into AI-powered day trading, Trade Ideas might be a better fit. Finally, TradingView is a solid all-around choice for many traders wanting a global community and charts for ETFs, Futures, and Crypto.
Costs and Plans
Can I Use TC2000 for Free?
Yes, TC2000 has a free version. It lets you view stock and options charts, draw trendlines, screen, and plot a few indicators. It’s pretty basic; you can’t do much else without paying.
Silver Plan Costs and What You Get
The Silver plan costs $9.99 a month. You also need to pay $14.99 a month for data. I don’t think it’s worth it. Here’s what you get:
| Charts with more tools | Real trading through TC2000 |
| Watchlists | Info on 100,000 stocks, options, and funds |
| Paper trading | A place to write notes |
Gold Plan Costs and What You Get (I Like This One)
The best deal is the TC2000 Gold plan, which costs $29.99 a month. You can save 25% if you pay for six months at once. I think this plan is the best deal because you get:
| Scans update every 1 minute | Alerts to your email or pop-up on screen |
| Set up 100 alerts | Detailed options strategies |
| Unlimited indicators | Make your own formulas |
Platinum Plan Costs and What You Get
The Platinum plan costs $59.98 a month. It’s the most expensive and, in my opinion, overkill. You get tick-level realtime data, can set up 1,000 alerts, and can create custom indicators.
I think TC2000’s prices are good compared to other tools. The free version is okay to start, but you’ll want more features soon. The Silver plan isn’t great for the price. I really like the Gold plan because it has the best mix of useful tools and a fair price. The Platinum plan is for serious traders who need the extra features.
Gold or Platinum: Which to Choose?
I think both Gold and Platinum are great options for TC2000 users. Platinum gives you some cool extras like realtime scanning and making your own indicators. If you trade stocks through TC2000 Brokerage, you can get $300 back each year on Platinum. That’s pretty sweet! It’s up to you which fits your needs best.
Get a Great Deal on TC2000
I’ve got some exciting news for you! TC2000 is offering a sweet discount that you won’t want to miss. If you sign up for a bi-annual subscription, you’ll save an extra 25% on TC2000. That’s a lot of savings!
Trading Like a Pro
Live trading with TC2000 is something else. For a dollar a trade, I can play the market straight from my charts. It’s pricier than some free options, but the seamless setup is worth it.
Check this out – I can set up trades based on pretty much anything. Want to buy when earnings hit a certain mark? Done. Do you feel like selling when the price breaks through a specific level? Easy peasy. It’s like having a super-smart trading buddy who’s always on the ball.
Here’s a quick rundown of what I can do:
- Trade right from my charts
- Set up custom buy and sell triggers
- Use tech indicators or company stats to guide my moves
- Keep everything in one place – no more juggling apps
It’s pretty cool stuff, and it makes me feel like I’m really in control of my trading game.
Smart Options Plays
I love how TC2000 makes options trading a breeze. With just a click, I can open up a world of strategies right on my chart. It’s super handy to have bullish, bearish, and volatility plays all sorted out for me. Whether I’m in the mood for a simple call or want to get fancy with multi-leg combos, it’s all there at my fingertips.
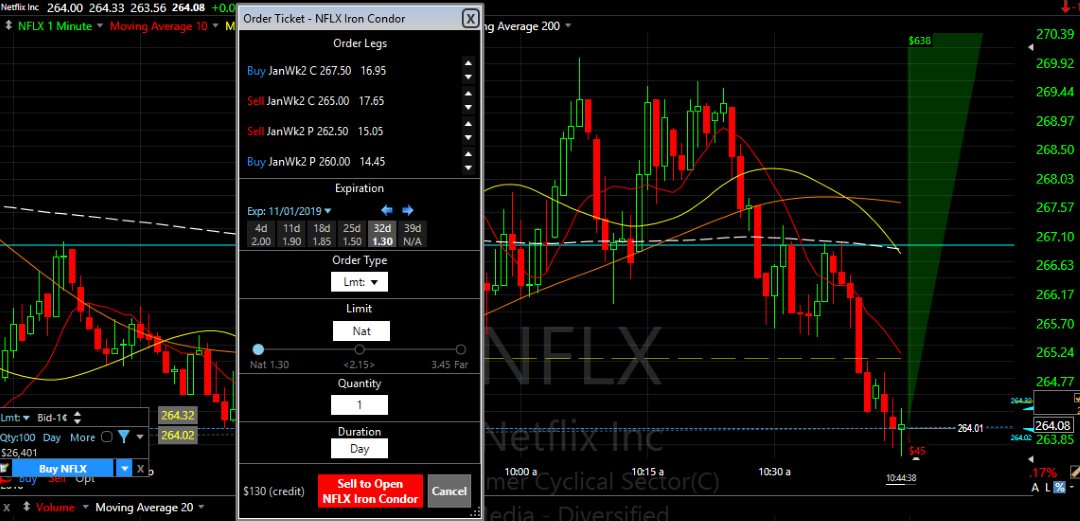
The best part? I can set up scans to find the perfect options trade, then jump right in from my chart view. It’s like having a personal options wizard at my side. And when it comes to keeping tabs on my wins (and losses), TC2000’s tracking tools are top-notch.
Charting
I love using stock charts to analyze market trends. They’re packed with useful info like opening and closing prices, highs and lows, and volume data. I find these visual tools critical for spotting patterns and making smart trading choices.
TC2000 over 240 technical indicators – that’s a lot to play with! I often use things like moving averages, RSI, and Bollinger Bands to get a clearer picture of what’s happening with a stock.

I also love using drawing tools like trend lines and Fibonacci retracements. They help me visualize support and resistance levels more easily.
One really cool feature is live alerts. I can set them up to ping me when a stock hits a certain price or crosses a trend line. It’s super handy for staying on top of market moves without being glued to my screen all day.
Screening & Scanning
I’ve found a great way to pick out promising stocks. I use TC2000 to scan the whole market quickly. It helps me find companies with strong growth potential.
Here’s what I look for:
- How much of sales turn into earnings
- Recent growth in earnings per share
- Steady earnings growth over time
- Positive cash flow
- Increasing revenue
- Number of shares available
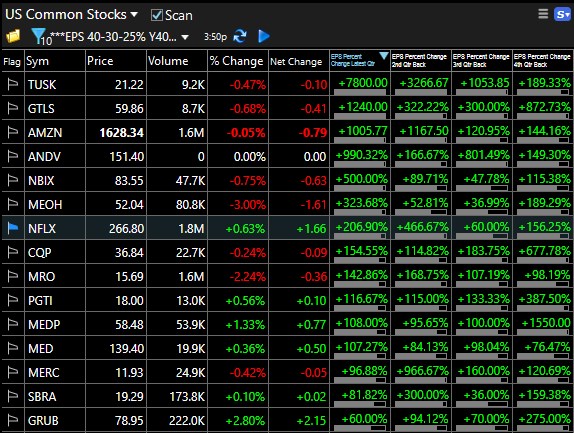
I love that I can plot these numbers right on stock charts. It lets me see how a company’s finances line up with its stock price moves. This mix of financial data and stock patterns gives me a fuller picture.
I start by setting up my scan with these criteria. Then, I make a watchlist of the stocks that pass my test. I keep an eye on this list and look for good entry points.
TC2000 makes it easy to adjust my scans. If I want to focus on different aspects, I can change my criteria with just a few clicks. I can even make my own indicators based on the financial data.
This approach helps me find stocks before they make big moves. By looking at both the numbers and the charts, I get a good sense of which companies might be ready to take off.
I’ve been using this method for years, and it’s helped me spot many winners. It takes some work to set up, but once it’s running, it saves me tons of time. Instead of digging through financial reports all day, I can focus on the stocks that look most promising.
View Entire Sectors
Just like that, I had access to a cool industry sector breakdown. It’s amazing how quickly I could dive into market data.
The layout shows me how different tech sectors like semiconductors, gaming, and solar are doing compared to the S&P 500. I can easily spot which areas are beating the market. It’s a great way to get a quick overview of sector performance.
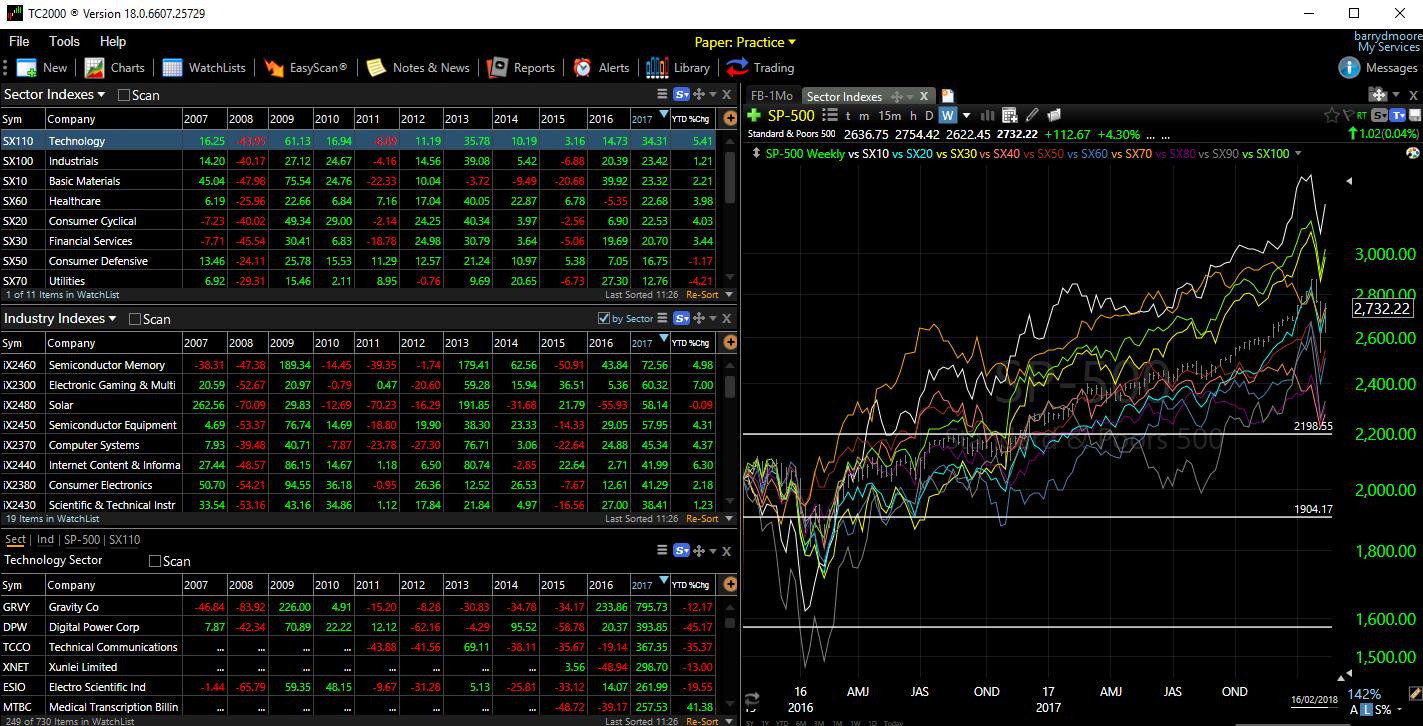
TC2000’s tools are straightforward and powerful. The layout is clean and makes sense, even for beginners. I appreciate how it balances looking good with being useful. Whether I’m checking my watchlist or running a scan, everything is right where I need it.
Newsfeed
I’ve looked into TC2000’s news options and found a mixed bag. The basic version lets you click links to popular finance sites like Google Finance and Yahoo Finance. It’s okay, but not great.
For $8 more per month, you can get Live Briefs from MT Newswire Investor. It’s pretty solid if you don’t need up-to-the-minute updates. But if you want the latest news as it happens, you’ll need to shell out $50 monthly for the full MT Newswire service. Yikes!
If you’rerealtimeinto realtime news, you might want to check out Benzinga PRO or MetaStock R/T instead. They have better options for that kind of thing.
Testing Your Stock Strategy
I love using historical data to see how well my stock ideas would have worked in the past. It’s like a time machine for investing! TC2000’s platinum plan lets me check old conditions and scan results, which is pretty neat. But it’s not quite the same as full-on backtesting.
If you’re really into deep strategy testing, TC2000 might not be the best fit. But it can still be handy for basic historical checks. I like to use my own formulas and criteria when analyzing past stock performance. It helps me feel more confident in my picks!
Software
I’ve used TC2000 on Windows since 1999. It’s fast and easy to use. The software looks great and works smoothly. You can download it quickly and set it up in no time.
You can use TC2000 on Macs, iPhones, and iPads at no extra cost. To run the Windows version on Apple devices, you’ll need the free Parallels Client App.
Download TC2000 for Your Desktop for Free
I’ve tried the new TC2000 App, and it’s great. It runs smoothly on all devices now, and it is powerful and easy to use for stock analysis.
Support
I’ve had great experiences with TC2000’s support. When I call, I get through quickly to knowledgeable staff in the US. They’ve solved my issues fast every time. The forums and email support are also top-notch.
Final Words
TC2000 is a top-notch tool for analyzing stocks and scanning the market. It has won awards in Stocks & Commodities Magazine for 25 years straight. I find it great for US investors who want good charts, indicators, and ways to examine company financials. The platform is easy to use and has everything I need to study stocks and make smart choices. It’s a solid pick for anyone serious about investing in the US market.
★ Discover our list of free stock analysis software to unleash your inspiration! ★
