Researching stocks can seem daunting, but it’s an important skill for any investor. The key is using reliable tools and reports to find good investment opportunities. With online platforms, it’s easier than ever to access financial data and stock research. The real challenge is figuring out which sources to trust and how to use all this information effectively.
To research stocks well, I look at a company’s financial health, what’s happening in their industry, and their potential for future growth. I pay close attention to changes in financials, business operations, and industry trends.
Stock Research Reports
Stock research reports are my main tool for analyzing companies. I use them to get a clear picture of a firm’s finances, competitors, and investment potential. Stock analysis reports give me a clear picture of a company’s financial health by looking at balance sheets and cash flow. I can see how well the business is run and if it’s positioned well in its industry.
Good research reports will not just be packed with numbers; they need to use charts to signify key trends over time, such as earnings and sales growth.
Leading Stock Research Services
I have subscriptions with three companies for in-depth stock research and screening services: Stock Rover, Motley Fool, and Benzinga. These platforms offer in-depth analysis, ratings, and recommendations.
Here’s a comparison of top research services:
| Research Service | Rating | Price Per Year | Features |
|---|---|---|---|
| Stock Rover Premium Plus | ★★★★★ | $0-$279 | Portfolio Mgmt, Screening, Real-time Research Reports |
| Motley Fool Stock Advisor | ★★★★★ | $199 | Stock Picking Recommendations & Research Reports |
| Benzinga Pro Real-time News | ★★★★★ | $799 | Real-time Company News and Financials |
| Morningstar Premium | ★★★★☆ | $249 | Research Reports |
| Zacks Ultimate | ★★★★☆ | $2995 | Reports & Recommendations |
- Stock Rover Premium Plus is my top pick for value, growth, and dividend investors.
- Motley Fool Stock Advisor offers expert stock picks for a yearly fee, with more to learn in my Motley Fool review.
- Benzinga Pro gives real-time news to its subscribers. For more information, see my Benzinga review.
- Morningstar Premium provides deep financial research with ratings.
- Zacks Ultimate charges more for special investment strategies and data.
- IBD Leaderboard focuses on tools for growth stocks.
- Seeking Alpha Pro is a high-end service for stock market analysis.
I also recommend checking out the SEC’s EDGAR database for important company filings. The Form 10-K and Form 10-Q reports provide key yearly and quarterly information for evaluating companies.
Free Stock Research Reports
Stock Rover offers free research reports for all companies on the Dow Jones 30 Index. These reports are a great resource for investors looking to get detailed information on major stocks without paying extra fees.
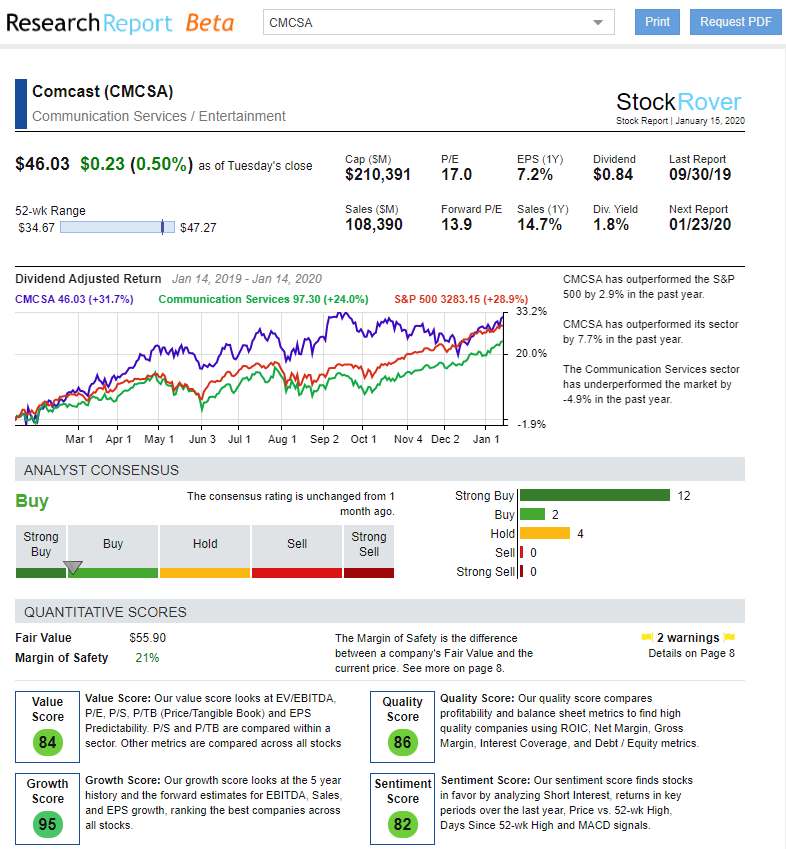
Stock Rover’s Dynamic Research Report is a standout feature. It creates real-time PDF reports on a stock’s performance, both current and historical. These reports are easy to read and give a clear picture of a company’s market position and potential returns.

I was particularly impressed by the dividend-adjusted commentary on Comcast. This kind of insight helped me make informed investment decisions using tools like the Buffett Stock Screener.
The reports cover over 10,000 stocks on US and Canadian exchanges. You can view them in your browser or download them as PDFs. This makes it easy to share the information or take it with you.
Here’s what’s included in a typical Stock Rover research report:
- Company overview
- Financial data
- Competitive analysis
- Historical performance
- Dividend information
- Potential future returns
- Important warnings about potential financial irregularities
These reports are valuable tools for investors who want up-to-date, comprehensive stock information. They provide a professional-level analysis that’s accessible to individual investors. Further information can be found in my Stock Rover review.
Types of Stock Research
I use two main types of stock research: fundamental analysis and technical analysis.
Fundamental analysis examines a company’s financials, management, and industry position. I examine earnings reports, debt levels, and growth potential.
Technical analysis focuses on stock price patterns and trading volume. I use charts and indicators to spot trends and predict future price movements. Some investors combine both approaches. Quantitative research uses math and statistics to analyze stocks, while qualitative research relies more on subjective factors like brand strength or management quality.
How to Research Stocks
Researching stocks takes time and effort, but it’s crucial for making informed investment decisions. To start, I like to define my investment goals and risk tolerance. This helps me focus on stocks that align with my strategy.
Next, I gather information about the company I’m interested in. I look at:
- Financial statements (income statement, balance sheet, cash flow)
- Key performance metrics (revenue growth, profit margins, debt levels)
- Industry trends and competition
- Management team and their track record
I find this data using reliable financial websites and the company’s investor relations page. It’s important to compare a stock’s performance to its peers and the broader market.
Here’s a simple checklist I use:
- Check the company’s financials
- Analyze growth potential
- Assess competitive advantage
- Review management quality
- Consider valuation metrics (P/E ratio, PEG ratio, etc.)
I also pay attention to news and recent developments that might affect the stock’s price. Remember, many factors, including market sentiment and economic conditions, can influence stock prices.
Mainstream analyst reports can be helpful, but I take them with a grain of salt. Morningstar, Zacks, and Moodies typically have an inherent positive bias, which might not be in your best interest. That’s why I like Stock Rover’s research reports: They are unbiased and programmatically highlight potential financial irregularities.
Lastly, remember that past performance doesn’t guarantee future results. The stock market can be unpredictable, so I always consider my risk tolerance and diversify my investments.
Stock Rover – The Smart Choice for Savvy Long-term Investors
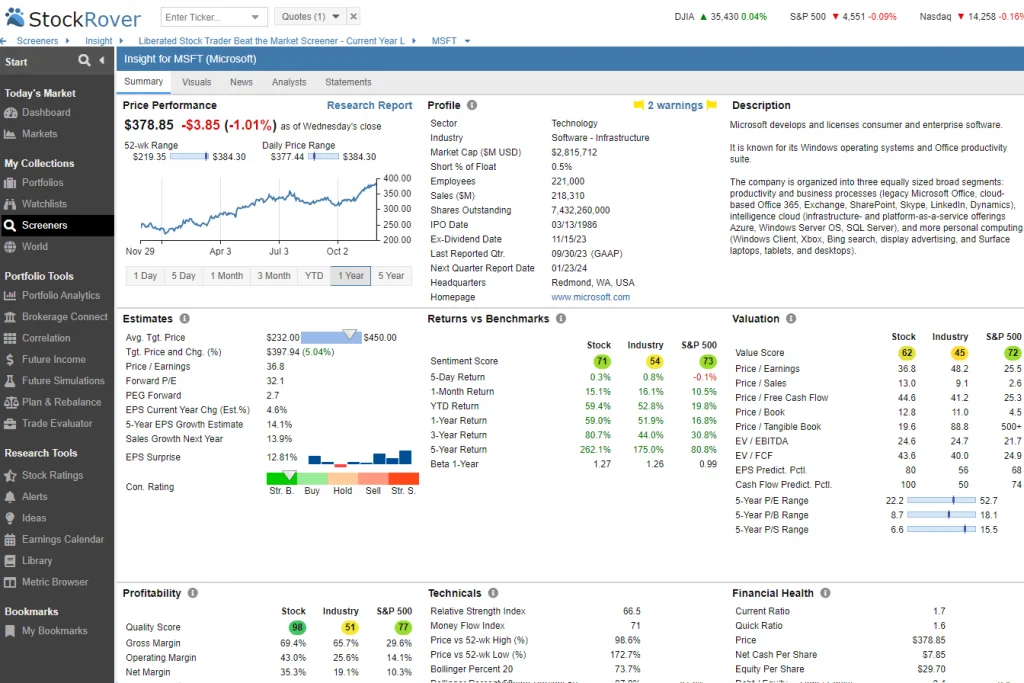
As an investor, I’ve always wanted powerful insights without the complexity. Stock Rover changed the game for me. With its deep screening tools and hundreds of metrics, I can quickly find stocks and ETFs that match my strategy. It streamlined my research and made decision-making so much easier.
Comparing investments used to be a hassle—now it’s a breeze. Stock Rover lets me analyze multiple stocks, ETFs, or portfolios side by side. I get clear views on fair value, quality, and growth potential, helping me make smarter, more confident choices.

Tracking my portfolio is now seamless. By linking my brokerage, I get real-time updates and detailed analytics. Features like dividend forecasts and rebalancing tools help me stay on track and plan effectively for the long term.
Stock Rover is the only service I recommended for growth, dividend, and value investors.
Stock Research Process
I find it crucial to start my stock research by examining financial statements. I look at the income statement, balance sheet, and cash flow statement to get a clear picture of a company’s financial health.
When I consider analyst reports, I take them with a grain of salt. I’m aware that analysts often shy away from negative comments, which can create a skewed positive bias. I make sure to understand the difference between terms like “buy” and “strong buy” to avoid being misled.
I always look for signs of systemic bias. Analysts tend to favor “buy” recommendations over “sell” ones, so I consider this.
To align with my investment goals, I do my own research. I’ve developed a process for examining and picking individual stocks for my portfolio. This helps me move beyond Wall Street’s often rosy outlook and create a more balanced approach to stock analysis.
10 Important Financial Metrics I Use
When I’m researching stocks, I rely on several key financial metrics to gauge a company’s health and potential. Earnings per share (EPS) tells me how much profit a company makes per share of stock. I use the price-to-earnings (P/E) ratio to see if a stock is overvalued or undervalued compared to its earnings. Return on equity (ROE) and return on assets (ROA) show me how well a company uses its resources to generate profits.
I always check the financial statements for trends in revenue and net income. The cash flow statement is crucial – it reveals how a company manages its money. I look at the debt-to-equity ratio to understand the company’s financial leverage. Dividend analysis helps me assess the company’s commitment to shareholder returns.
Here’s a quick summary of key metrics I focus on:
- EPS (Earnings Per Share): A measure of a company’s profitability calculated by dividing net income by the number of outstanding shares.
- P/E Ratio (Price-to-Earnings Ratio): A valuation metric showing the price investors are willing to pay for $1 of a company’s earnings.
- ROE (Return on Equity): Indicates how effectively a company uses shareholder equity to generate profits.
- ROA (Return on Assets): Measures a company’s ability to generate earnings from its total assets.
- Revenue Growth: Tracks the percentage increase or decrease in a company’s sales over a given period.
- Net Income Trends: Examines the changes in a company’s profitability over time to assess financial health.
- Cash Flow: Represents the net amount of cash generated or used by a company during a specific period, indicating liquidity.
- Debt-to-Equity Ratio: A solvency metric that compares a company’s total liabilities to its shareholder equity to assess financial leverage.
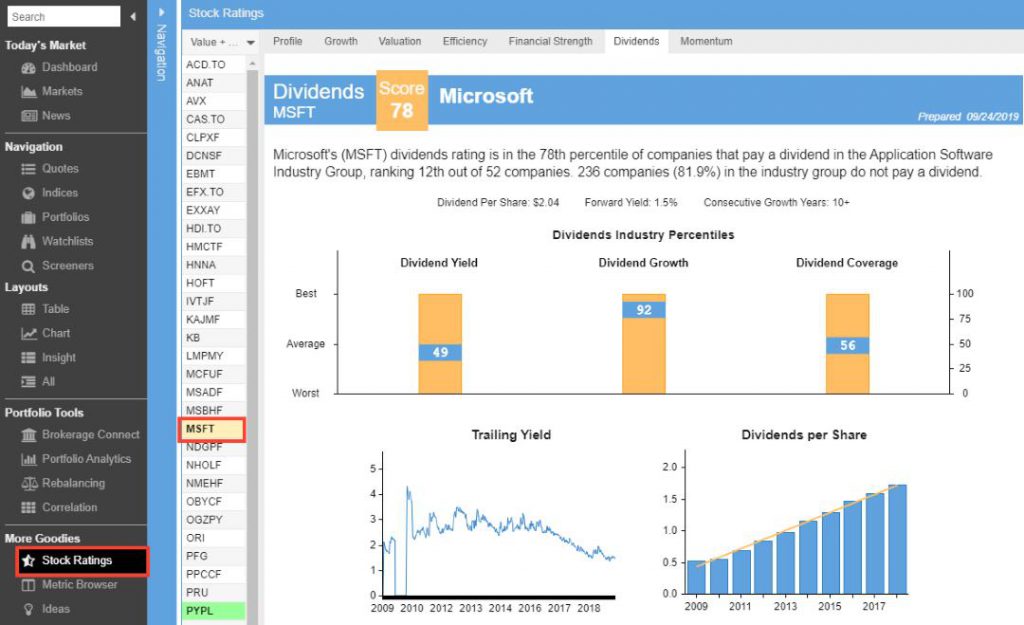
- Dividend Yield: The annual dividend income as a percentage of the stock price, showing the return to shareholders.
- Industry Comparisons: Evaluates a company’s performance metrics relative to its peers to determine competitiveness.

Stock Research Strategies for Intraday Trading
Successful intraday trading relies heavily on technical analysis and real-time data. I use stock charts to spot short-term price trends and patterns. These visual tools help me make quick decisions about when to buy or sell.
Key indicators I watch include moving averages and Bollinger bands. These help signal potential entry and exit points for trades. I also monitor trading volume, which can confirm price movements or suggest upcoming shifts.
Options activity is another valuable source of information. Unusual options volume or changes in implied volatility can hint at market sentiment.
Here’s a quick list of tools I use daily:
- Real-time stock price feeds
- Interactive charting software
- Technical indicators
- Options chain data
By combining these resources, I aim to capture small price movements throughout the trading day. This fast-paced approach requires constant attention to market dynamics.
Avoid Social Platforms in Stock Research
I find that YouTube, TikTok, and Twitter are hotbeds of self-proclaimed stock experts. Many users claim to have insider knowledge but lack real market experience. Users often spread rumors about stocks without solid proof. Facebook investing groups are another red flag. They lack proper oversight and attract people looking to take advantage of new investors.
It’s crucial to research more than social media posts when making investment choices. Don’t take stock tips at face value without doing your own research.
Evaluating Influencers
I question why someone is pushing certain stocks or crypto online. Are they really knowledgeable, or are they just trying to pump up prices for their own gain? I look for hard data and analysis to back up claims. Solid sources provide facts, not just opinions.
I also check if the person has a track record of successful investments. Have they accurately predicted market trends before? If not, I’m skeptical of their advice.
Pay attention to any disclaimers or disclosures. Some influencers may have hidden motives that affect their recommendations. I stay critical when evaluating social media stock tips. While these platforms can offer insights, I always do my own fact-checking before investing.
Beginner Steps
For those new to stock research, I suggest these initial steps:
- Set clear goals: Know your financial aims and risk tolerance.
- Start with big names: Focus on well-known, stable companies at first.
- Do fundamental analysis: Look at the company’s financials, market position, and competitors.
- Use reliable news sources: Stay informed with trustworthy financial news and market analysis.
I recommend using stock research reports to help make decisions. But don’t rely on them alone. Always do your homework to understand the risks and opportunities.
FAQ
What is a stock research report?
A stock research report is a document from an investment firm that breaks down a public company’s finances, industry standing, and growth potential. It often includes buy, hold, or sell recommendations.
How often are stock research reports updated?
Update frequency varies. Traditional reports often come out quarterly, matching company earnings releases. Some services, like Stock Rover, update daily.
What should I look for when reading a stock research report?
When I read a stock research report, I focus on:
The investment thesis
Financial analysis
Industry overview
Management assessment
Risks and opportunities
Analyst’s price target and recommendation
Can I trust the information in stock research reports?
I view stock research reports as valuable, but I’m aware of potential biases. Analysts may have conflicts of interest. I use reports as part of a broader research strategy and cross-check information with other sources.
What is the difference between equity research reports and technical analysis reports?
Equity research reports focus on a company’s fundamental financial health and market position. Technical analysis reports look at stock price movements and trading volumes to predict future trends based on patterns and indicators.
