Stock heatmaps provide a dynamic view of market conditions, displaying financial performance by sector or market cap, allowing traders to assess trends quickly. However, my research into the best heatmaps has uncovered some really innovative applications of this long-established concept.
The most cutting-edge heatmap tools for traders include TradingView for comprehensive global insights, TrendSpider for unmatched flexibility, Finviz for free US market heatmaps, and Stock Rover for detailed investor-focused heatmaps.
Heatmaps are invaluable for both novice and experienced investors as they visualize data in an easily digestible format, highlighting opportunities or risks across various sectors.
I have personally tested over 25 financial heatmap tools, and here are my top six.
My Favorite Stock Market Heatmaps
- TradingView offers a global market view with outstanding graphics and 17 sortable criteria.
- TrendSpider has 58+ selectable criteria and leading flexibility across US stocks, ETFs, currencies, cryptocurrency, and industry sectors.
- Finviz has excellent free heatmaps, with popup charts when hovering over a symbol.
- Stock Rover provides financial heat maps for US stocks and ETFs that are customizable to your portfolio.
- Yahoo has super simple free heatmaps with easy navigation.
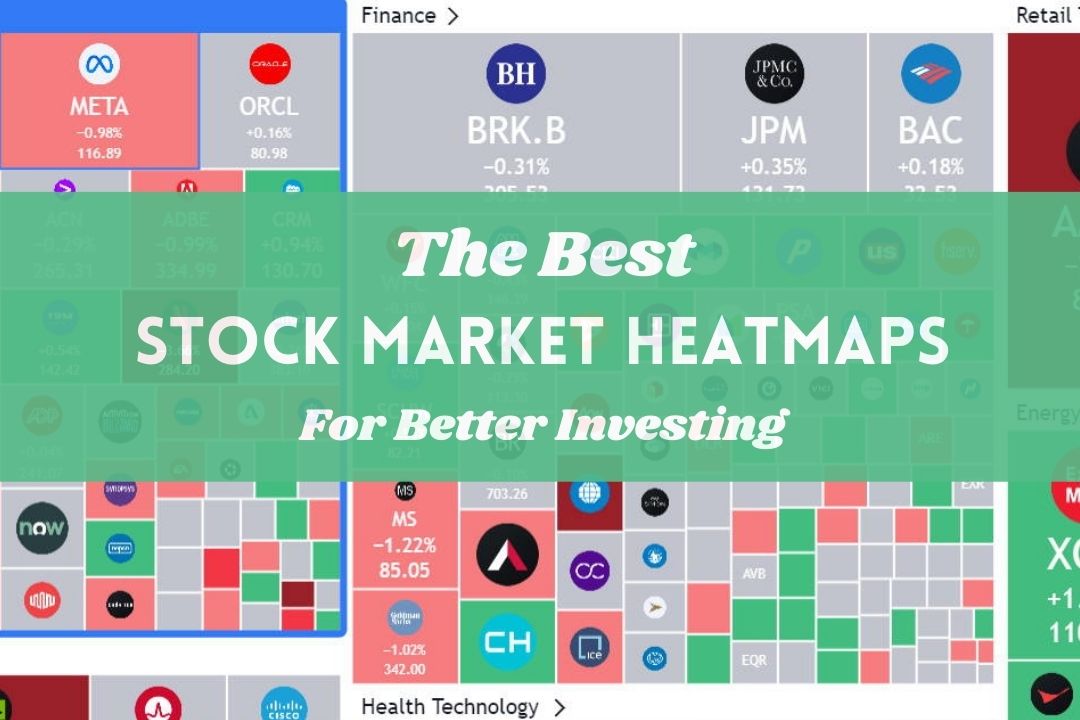
Using stock market heatmaps, I can visualize real-time data for stock price changes, volatility, and volume. This tool helps me see patterns in market behavior quickly. By grouping stocks by factors like market cap, I can evaluate their performance efficiently.
1. TradingView: Winner – Global Heatmaps for Stocks, Fx, Futures & Crypto
My tests show that TradingView’s heatmaps stand out as the best in stock analysis. They cover 84 global exchanges, including stocks, Forex, and cryptocurrencies, providing versatility that suits day and swing traders. The platform offers free heatmaps and real-time heatmaps for premium services.

What makes TradingView exceptional is its speed and range of 45 fundamental and technical filters. Traders can sort data by different metrics, such as price, volume, and performance. The heatmaps visually integrate company logos, making navigation intuitive. The platform provides access to over 50,000 financial instruments from global stock exchanges, making it a one-stop shop for traders.
Moreover, TradingView has an active community of over 20 million users who share ideas, charts, and analyses. This allows traders to learn from others and stay updated on market trends. The social aspect also adds a layer of accountability as users can follow and track the performance of top traders. Read the full TradingView review for further details.
2. TrendSpider: Wiiner for Fully Customizable US Heatmaps
TrendSpider allows users to fully customize their heatmaps, offering a tool that accommodates personal trading strategies. Whether you need to tweak according to specific indicators or patterns, TrendSpider is flexible. It appeals to technical analysts who value a tailored approach to stock data visualization.
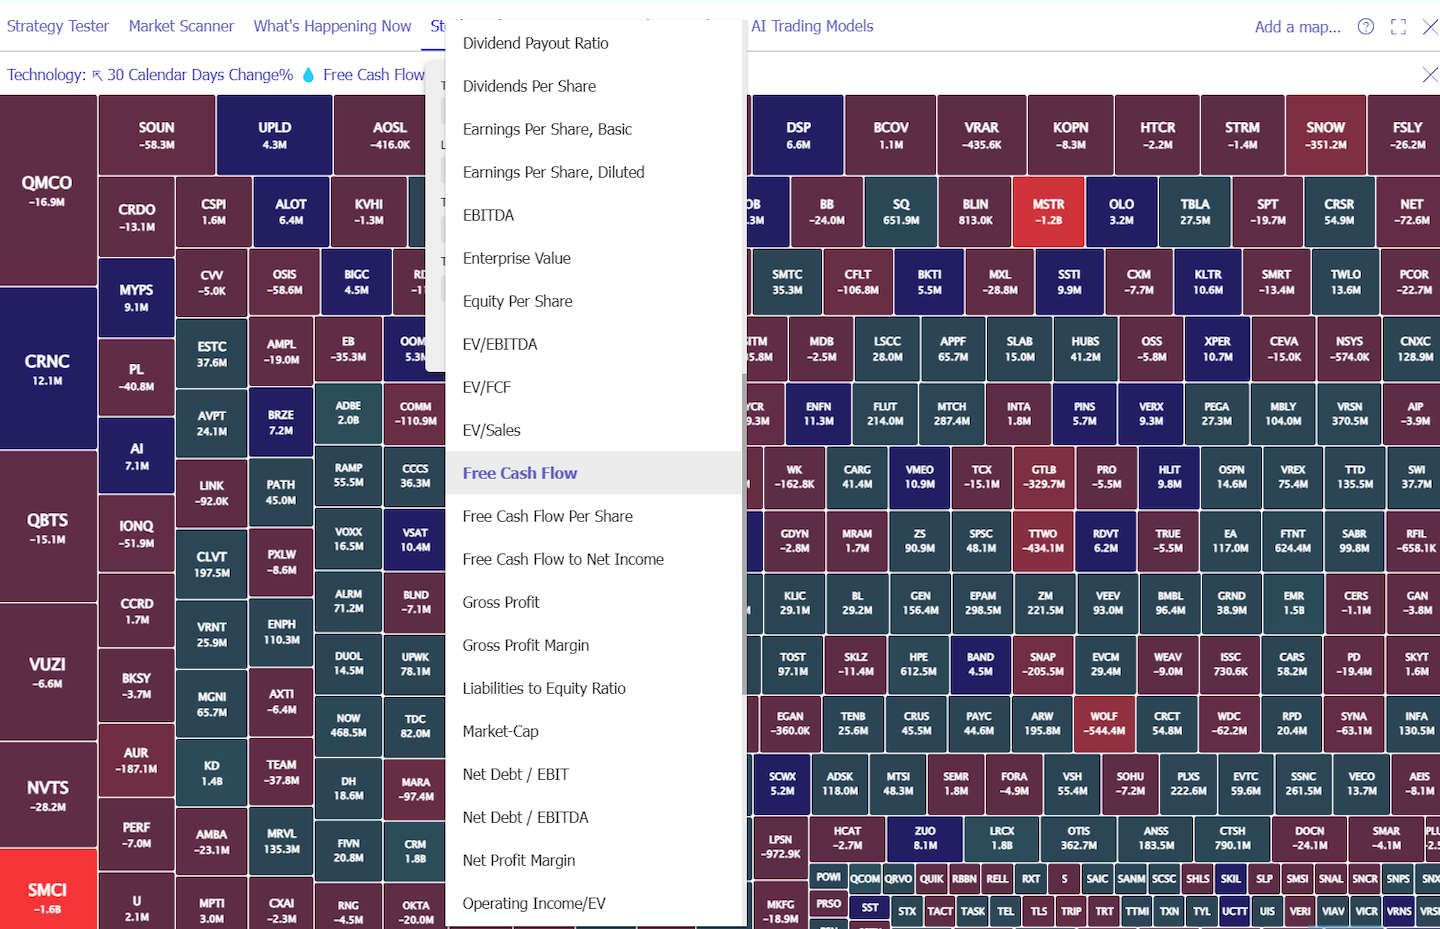
TrendSpider offers over 58 selectable criteria, providing unmatched flexibility for traders and investors. It supports analysis across a wide range of markets, including US stocks, ETFs, currencies, cryptocurrencies, and various industry sectors. Whether you’re a beginner or an experienced trader, TrendSpider equips you with powerful tools to refine your strategies and target good trades. Read my TrendSpider review for further details.
3. Finviz: Winner for World Heatmaps
Finviz offers an outstanding world heatmap by visualizing data from 24 stock markets globally. With a quick glance, I can see comprehensive sector performances. My favorite Finviz feature is the mini-charts that pop up when your mouse hovers over a tile. With Finviz Elite, the heatmaps provide real-time insights into sector and industry trends.
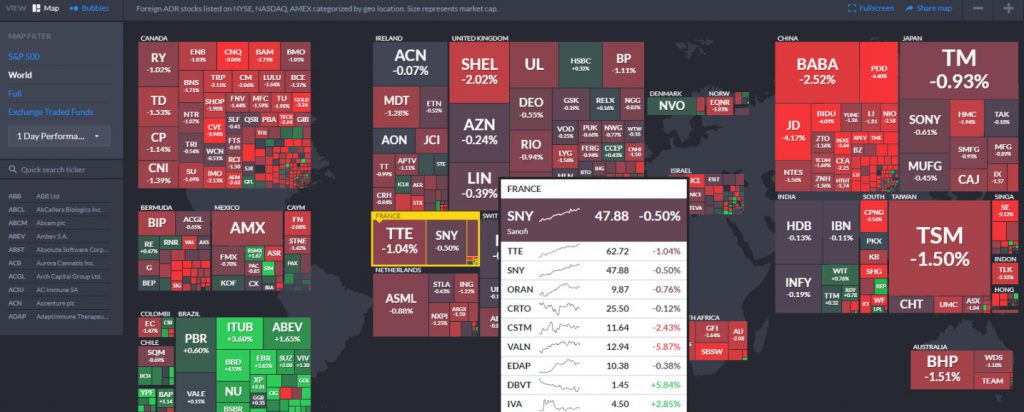
Finviz also excels in stock screening, delivering robust chart pattern recognition. It offers a free version, but the premium plan enhances the experience with real-time data and backtesting capabilities. This platform is particularly useful for investors interested in comprehensive global market analysis. My Finviz in-depth test provides further details
4. Stock Rover: Personalized Portfolio Heatmaps
Stock Rover is tailored for investors looking for personalized insights into their portfolios. With broker integration and analysis tools, I can manage stocks effectively. The platform connects directly with broker accounts, offering a realistic view of portfolio performance, including ROI and profit/loss metrics.
One of the main benefits of using Stock Rover is its powerful screening capabilities. The platform allows me to create custom stock screens based on my specific criteria, such as price, dividend yields, and financial ratios. This helps me narrow down potential investments and find hidden gems in the market.
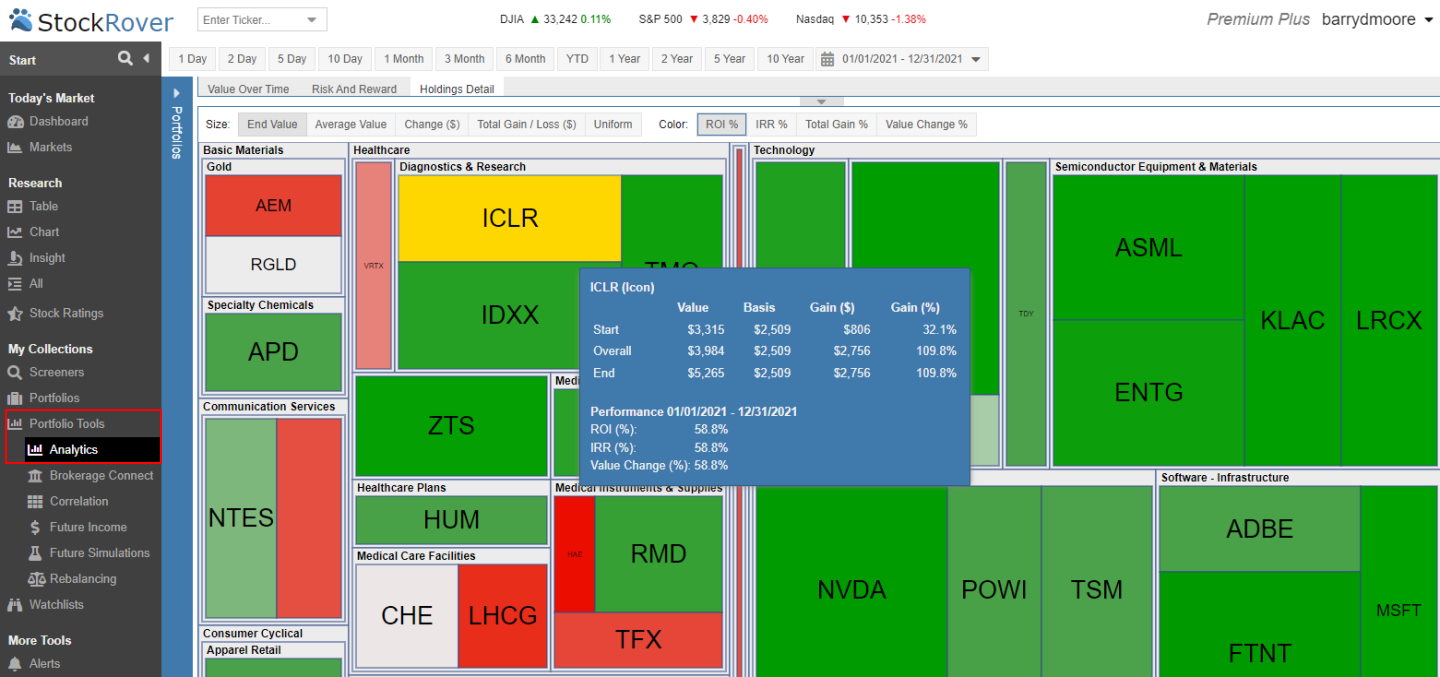
Furthermore, my Stock Rover testing shows it goes beyond heatmaps. It offers a powerful stock screener, and real-time research reports that assist in finding smarter investments. Stock Rover also offers a variety of charts and graphs for in-depth analysis. I can view historical data and track trends over time to better understand the performance of my investments. Additionally, the platform provides access to analyst ratings, insider trading information, and news articles related to particular stocks.
5. Yahoo: Free & Easy Heatmaps
Yahoo Finance provides free stock charts and heatmaps for 54 countries with an array of 101 stock filters. While the interface might seem basic, each ticker symbol offers further financial and news details. I find Yahoo heatmaps useful for getting a snapshot of global market movements.
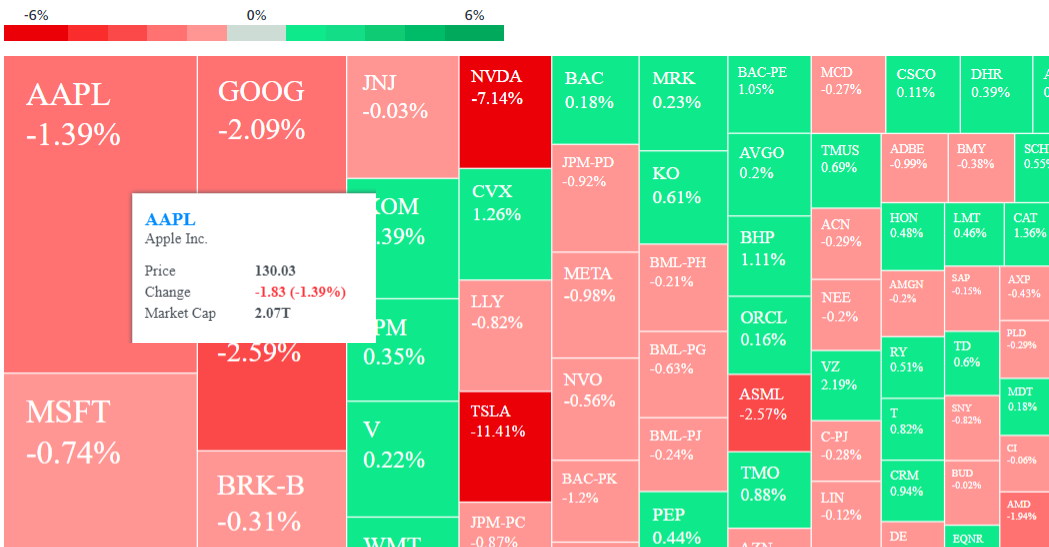
Yahoo’s tool opens up international markets to investors without a price barrier, offering a valuable free resource for tracking diverse markets worldwide.
6. Barchart: Basic Free Sector Heatmaps
Barchart focuses on the US market with heatmaps that include filters like price-earnings and dividend yields. It’s particularly useful for investors focusing on domestic sectors, providing a straightforward interface that I find user-friendly. The heatmaps allow for quick analysis of sectors and industries, with color-coding to highlight potential opportunities or risks.
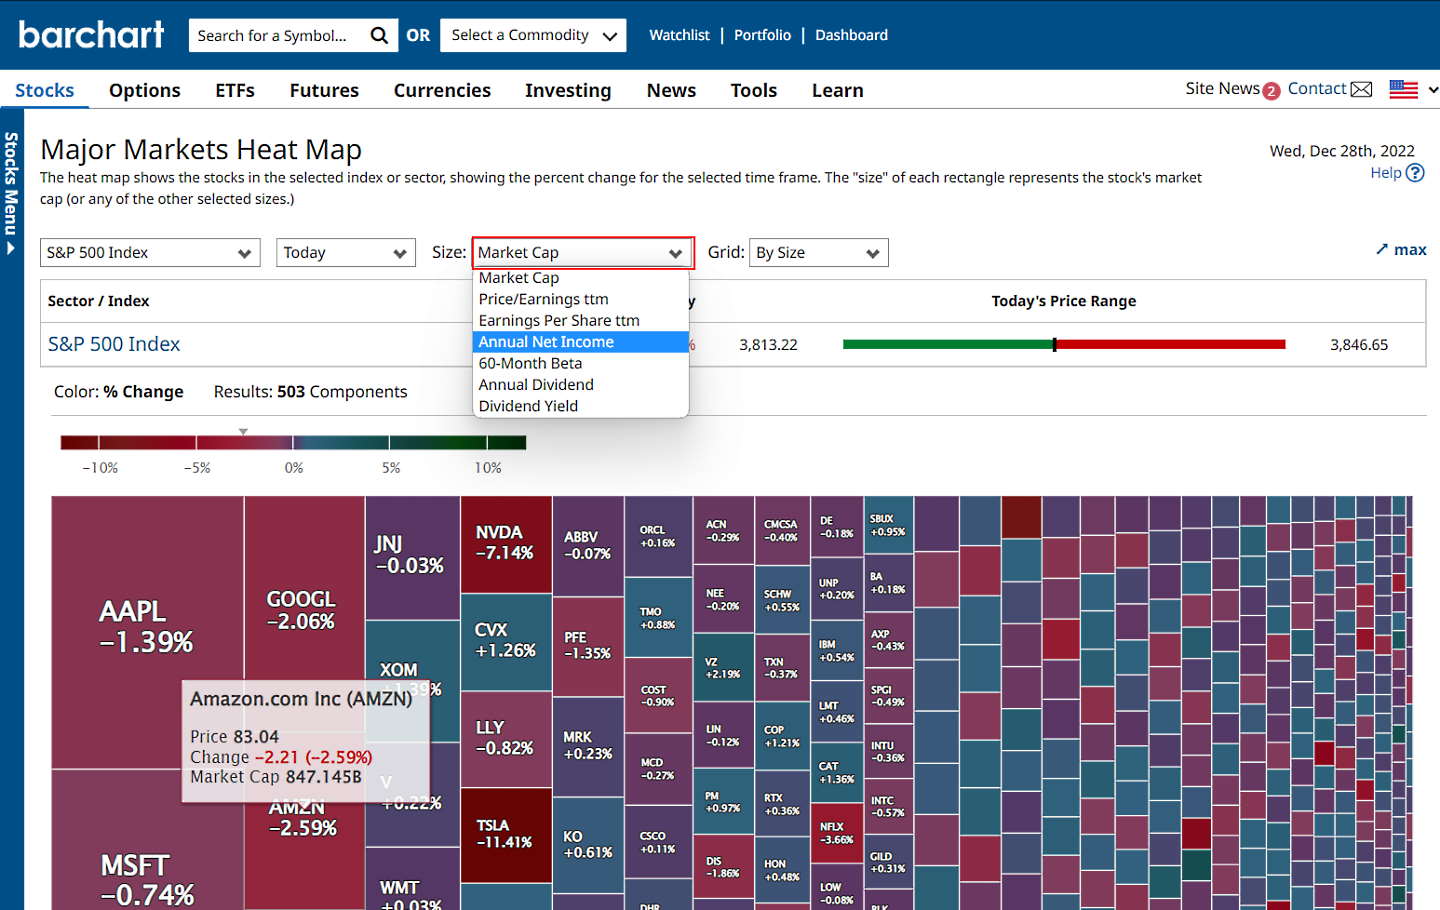
Barchart offers filtering options like a 60-month beta, providing an additional layer of analysis. With its emphasis on sectors within the US market, it serves as a practical resource for investors focused on American equities. However, as a free tool, it delivers only a fundamental implementation—useful but far from extraordinary.
FAQ
How can I read market heatmaps effectively?
Interpreting a stock market heat map involves recognizing patterns and color codes to quickly identify stock performances. Red usually indicates a decrease in value, while green signifies an increase. Grouping stocks by sectors can help spot trends and sector-wide movements.
What are the top stock heatmap tools for investors?
Stock Rover is the ideal heatmap tool for long-term investors because it offers customizable portfolio heatmaps tailored to key financial investing criteria.
What are the benefits of heatmaps in market analysis?
Using a heat map in stock market analysis provides a color-coded visualization of market trends, enabling quick assessments. It enables investors to quickly identify strong and weak sectors, track large-cap stock performance with ease, make decisions based on sector trends and save valuable time compared to processing raw data.
Can I create my own stock heatmap?
Yes, you can create your own heatmaps with TrendSpider. It allows you to fully customize your heatmap based on specific technical indicators and timeframes. This means you can create heatmaps for short-term trading strategies as well as long-term investment decisions.
What are the best heatmaps for traders?
TradingView and TrendSpider are the best heatmaps for traders because they all offer real-time data and fast access to charts and trading.
