I use two main approaches when analyzing stocks. The first is fundamental analysis, which examines key financial metrics like the price-to-earnings ratio, earnings growth, and cash flow. This gives me insight into a company’s underlying value and financial health.
The second method is technical analysis. Here, I examine stock price charts, trading volume, and various technical indicators. This helps me spot trends and potential entry or exit points.
By combining both fundamental and technical analysis, I can make more informed decisions about which stocks to buy or sell.
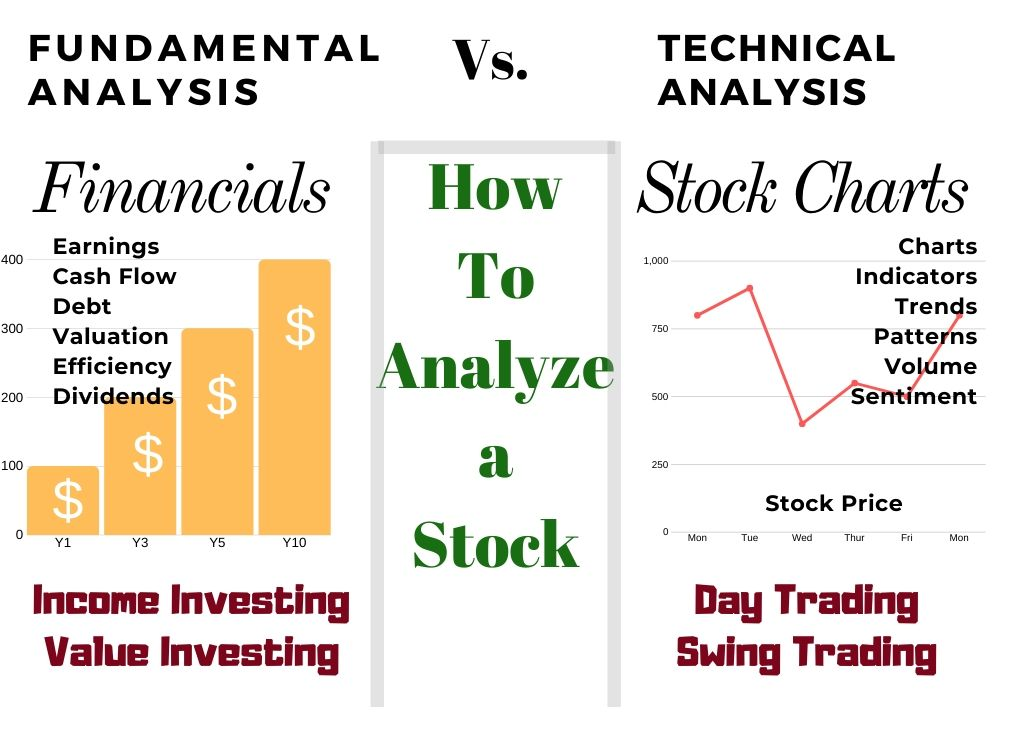
Analyzing Stocks: Fundamental vs. Technical Analysis
Fundamental and technical analysis are the core of good stock analysis. Fundamental analysis digs into a company’s financials, examining earnings, sales, and dividends to gauge its value. On the other hand, technical analysis focuses on a stock’s market situation, examining price, patterns, and trading volume.
As a long-term investor, I often use fundamental analysis to assess a company’s growth potential and intrinsic value. For shorter-term trading, I turn to technical analysis to spot trends and predict price movements.
Fundamental Stock Analysis
Fundamental analysis is a method I use to evaluate a company’s financial health and potential for growth. I look at key factors like profitability, sales growth, dividend payments, and cash flow. This helps me determine if a stock is priced fairly or if it’s a good investment opportunity.
When I do fundamental analysis, I ask myself:
- Is the company making money?
- Are sales increasing over time?
- Does it pay dividends to shareholders?
- Is the stock price high or low compared to its earnings?
- Does the company have enough cash to operate and grow?
- How efficiently does it use its resources?
By examining these fundamentals, I can get a clearer picture of a company’s overall financial strength and future prospects.
How to Analyze Growth Stocks
When I analyze growth stocks, I focus on rapidly expanding companies. I look for strong earnings growth, increasing revenues, and rising stock prices.
The CANSLIM method is a popular approach I sometimes use:
- C: Current quarterly earnings growth over 18%
- A: Annual earnings growth averaging 25%+ over 5 years
- N: New high stock price within the last year
- S: Supply of shares over 9 million
- L: Leading stock compared to competitors
- I: Institutional ownership over 35%
- M: Market in an uptrend
I pay close attention to quarterly earnings reports, as these often drive stock price growth. Strong earnings can lead to big price moves.
Stock Rover – The Smart Choice for Savvy Long-term Investors
As an investor, I’ve always wanted powerful insights without the complexity. Stock Rover changed the game for me. With its deep screening tools and hundreds of metrics, I can quickly find stocks and ETFs that match my strategy. It streamlined my research and made decision-making so much easier.
Comparing investments used to be a hassle—now it’s a breeze. Stock Rover lets me analyze multiple stocks, ETFs, or portfolios side by side. I get clear views on fair value, quality, and growth potential, helping me make smarter, more confident choices.
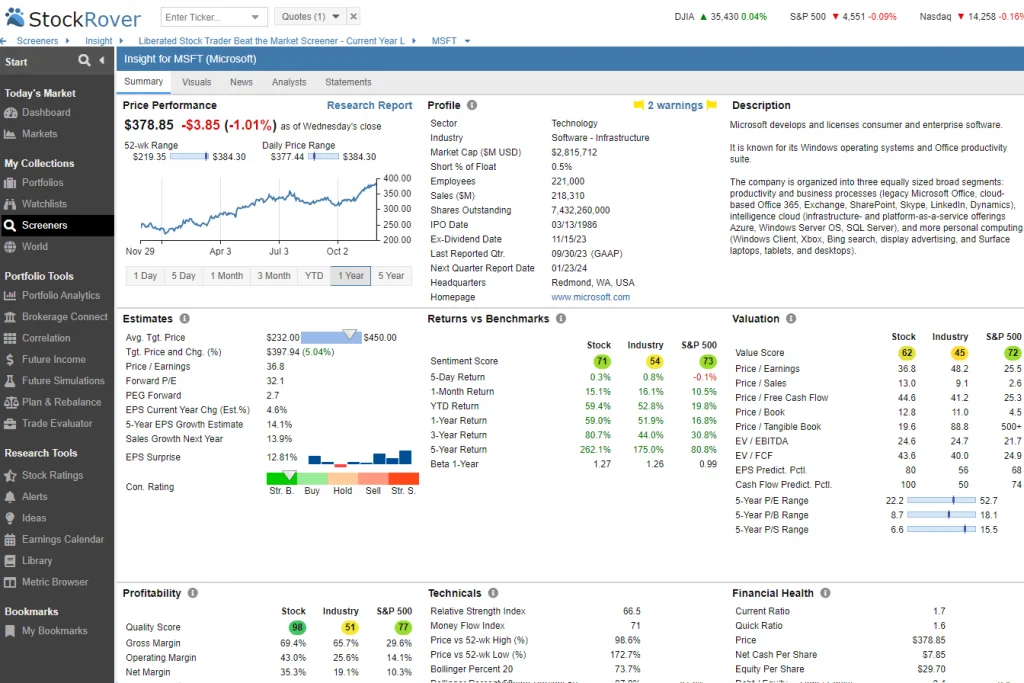
Tracking my portfolio is now seamless. By linking my brokerage, I get real-time updates and detailed analytics. Features like dividend forecasts and rebalancing tools help me stay on track and plan effectively for the long term.
Stock Rover is the only service I recommended for growth, dividend, and value investors.
How to Analyze Value Stocks
For value stocks, I’m looking for companies that are undervalued by the market. The goal is to find stocks trading below their intrinsic value – what I believe the company is really worth.
I calculate a stock’s intrinsic value by estimating its future cash flows. Warren Buffett famously looks at projected cash flows over the next 10 years. If I can buy a stock for much less than my calculated intrinsic value, that gives me a margin of safety.
The margin of safety is key for reducing risk. For example, if I think a stock is worth $100 but I can buy it for $70, that 30% discount is my margin of safety. The bigger the discount, the better.
I also look at metrics like:
- Price-to-earnings ratio
- Price-to-book ratio
- Price-to-sales ratio
Lower values here can indicate that a stock may be undervalued. However, I always investigate the financials and business model more thoroughly before investing.
How to Analyze Income & Dividend Stocks
When analyzing dividend stocks, my main concerns are:
- Dividend yield – The annual dividend payment as a percentage of the stock price
- Dividend growth – Is the company increasing its dividend over time?
- Payout ratio – The percentage of earnings paid out as dividends
I want to see a sustainable dividend yield, ideally growing each year. However, the payout ratio shouldn’t be too high, or the company may struggle to maintain the dividend.
How To Analyze A Stock for a Dividend Strategy
To find solid dividend stocks, I look beyond the current yield. I want to ensure that the dividend is safe and likely to continue.
I prefer larger companies, usually with market caps above $2 billion. They tend to have more stable cash flows to support dividends.
I look for dividend yields above 1.5%, but I’m careful about chasing very high yields. Those can sometimes signal trouble.
I also check the dividend history. I want to see consistent payments and, ideally, some growth over the past five years.

The payout ratio is crucial. I prefer ratios below 50%, meaning the company is paying out less than half its earnings as dividends. This leaves room for future increases.
Lastly, I make sure the company’s sales are growing. Rising revenues help ensure the dividend can be maintained or increased.
8 Criteria to Find Stocks for a Dividend & Income Strategy
- Market cap over $2 billion
- Dividend yield above 1.5%
- Positive 1-year dividend growth
- Positive 3-year average dividend growth
- Positive 5-year average dividend growth
- Listed on a major exchange (NYSE, NASDAQ, etc.)
- Payout ratio below 50%
- Sales growth rate higher than dividend growth rate
10 Ways to Fundamentally Analyze
I’ve found several key methods to analyze stocks financially. Here are 10 important ways to evaluate a company’s financial health:
Enterprise Value: This measures a company’s total value, including market cap, assets, cash, and debt. It’s useful for comparing companies of different sizes.
Price-to-Earnings (P/E) Ratio: I compare a stock’s price to its earnings per share. A lower P/E can suggest better value, but it’s best to compare within the same industry.
Shiller P/E Ratio: This uses a 10-year average of earnings to smooth out market cycles. It helps me spot overvalued or undervalued markets.
Price-to-Book (P/B) Ratio: I look at a stock’s market price versus its book value. A low P/B might signal an undervalued stock, but it could also mean trouble.
Debt-to-Equity Ratio: This shows how much debt a company uses to finance operations. I’m careful with high ratios, as they can mean more risk.
Current Ratio: I divide current assets by current liabilities. A ratio above two often suggests good short-term financial strength.
Quick Ratio: This is similar to the current ratio but excludes inventory. I look for values above 1 for better liquidity.
Solvency Ratio: This helps me see if a company makes enough cash to stay afloat. I aim for values above 20%.
Free Cash Flow: I check how much cash a company generates after capital expenses. It’s a good sign of financial health.
Earnings Power Value: This method avoids guessing future growth. I use it to get a more stable view of a company’s value.
Software for Stock Analysis
The Results of Analysing Stocks for Value Investing
I’ve found that using good stock analysis software can make a big difference in finding great stocks to invest in. Stock Rover is a top choice for US and Canadian investors. It lets you do all kinds of dividend investing strategies. I like that it has a 10-year dividend history and shows fair value estimates. Further information is in my Stock Rover review.
Stock Rover Rating: 4.7/5.0
| Pricing: ★★★★★ | News & Social: ★★★✩✩ |
| Software: ★★★★★ | Backtesting: ★★★★✩ |
| Trading: ★★★✩✩ | Pattern Recognition: ★✩✩✩✩ |
| Screening: ★★★★★ | Candlestick Recognition: ★✩✩✩✩ |
| Charts & Analysis: ★★★★✩ | Usability: ★★★★★ |
| Features | Rating ★★★★★ |
|---|---|
| Powerful Value, Growth & Dividend Features | ✅ |
| Broker Integration | ✅ |
| Backtesting | ✅ |
| Portfolio Management | ✅ |
| Financial News | ✅ |
| Markets Covered | USA |
| Assets | Stocks, ETFs |
| Free Trial | ✅ |
| Community & Chat | ❌ |
| OS | Web Browser |
| Discount Available | 25% Off with Annual Plan |
For investors looking at stocks outside North America, my TradingView review shows it’s a solid pick. It covers stocks from all over the world and has tools for dividend and value stock screening.
TradingView Rating: 4.7/5.0
| Pricing: ★★★★★ | News & Social: ★★★★★ |
| Software: ★★★★★ | Backtesting: ★★★★✩ |
| Trading: ★★★★✩ | Pattern Recognition: ★★★★✩ |
| Scanning: ★★★★✩ | Candlestick Recognition: ★★★★★ |
| Charts & Analysis: ★★★★★ | Usability: ★★★★★ |
| Features | Rating ★★★★★ |
|---|---|
| Buy/Sell Signals | ✅ |
| Automatic Trade Execution | ✅ |
| Trendline Recognition | ✅ |
| Chart Pattern Recognition | ✅ |
| Candlestick Recognition | ✅ |
| Backtesting | ✅ |
| Code-Free Backtesting | ❌ |
| Auto-Trading Bots | ✅ |
| Markets Covered | Global, USA, India, Europe, Asia |
| Assets | Stocks, Crypto, Fx, ETFs, Futures |
| Free Trial | ✅ |
| Community & Chat | ✅ |
| OS | Web Browser, Windows |
| Price/Month | From $12.95 |
| Discount Available | $15 Discount & 16% Annual Plan Discount |
Technical Stock Analysis
Technical analysis is a key method for stock traders and market timing. I look at supply and demand in the stock market to predict future price movements. The main factors I focus on are stock price, number of buyers and sellers, and traded volume. These elements come together in stock charts, indicators, patterns, and trends that I use to make trading decisions.
The core elements of technical analysis are price charts, trends, patterns, volume, and indicators.
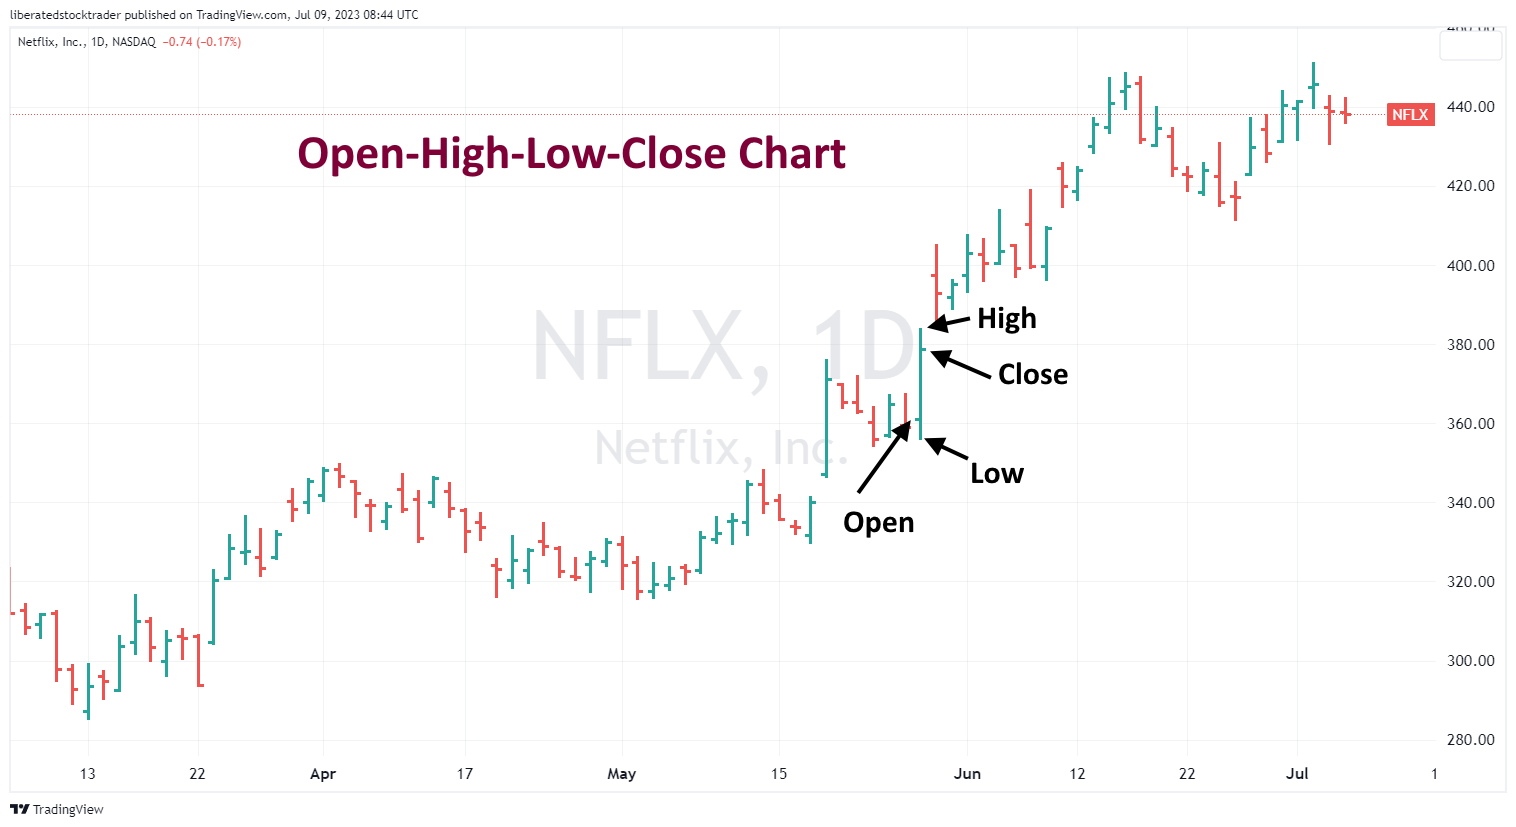
Price Charts
When I look at an OHLC (Open, High, Low, Close) stock chart, I see price movements at a glance. Green bars show price increases, while red bars indicate decreases. This visual representation helps me quickly determine if a trend is bullish (going up) or bearish (going down).
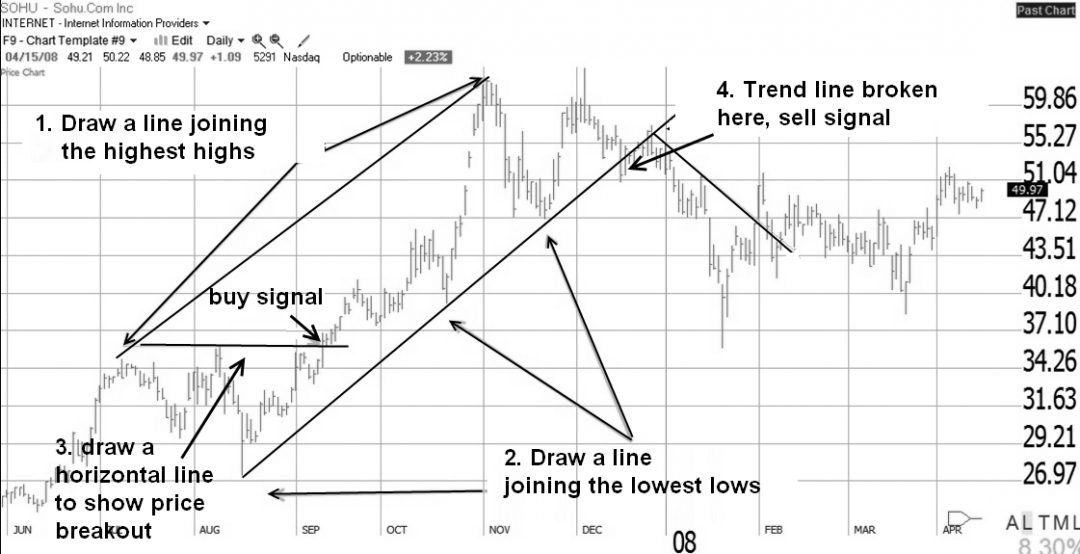
Trend Analysis
I often use support and resistance lines in my analysis. These lines can be drawn manually or automatically by chart indicators. Here’s an example of Apple Inc (AAPL) stock with trend lines showing upward and downward price moves:
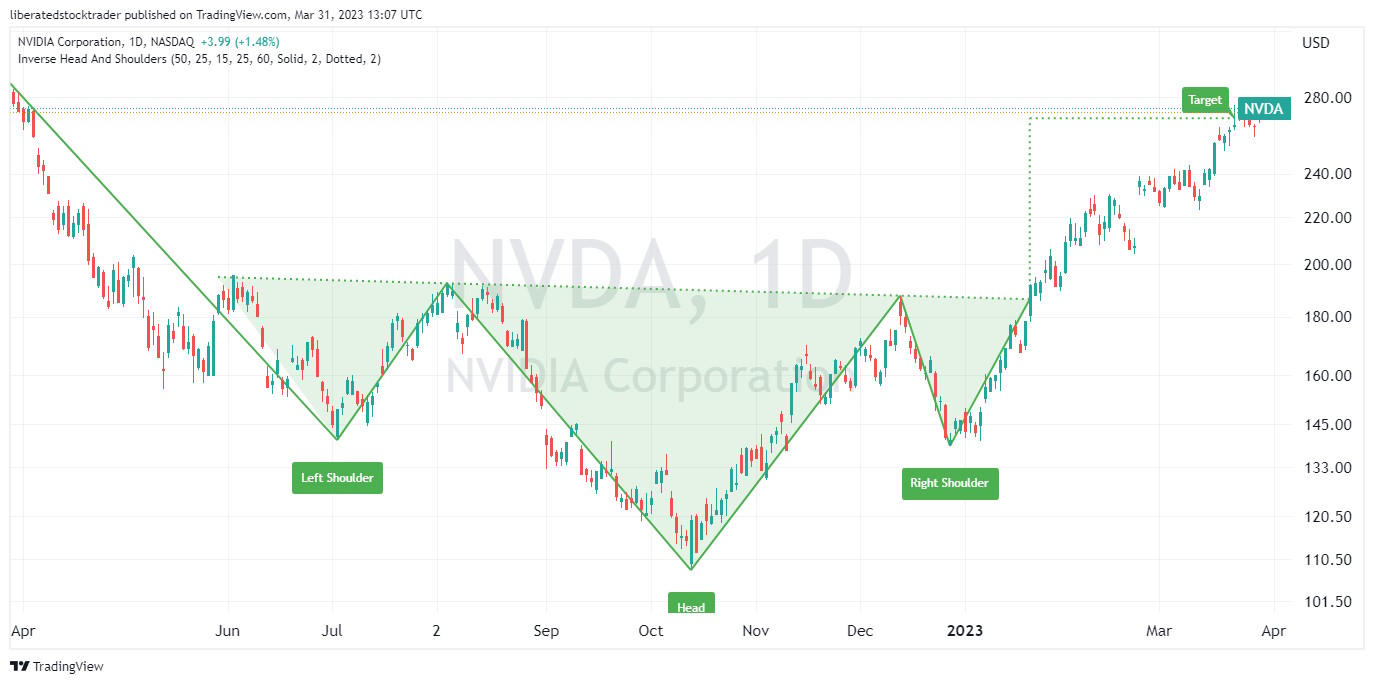
Price Patterns
My research shows that stock chart patterns are a proven way to achieve accurate market timing. That may sound like follow, but it is true. For example, the “Inverse Head & Shoulders” has a proven 89% chance of a 45% gain. Here is my research on highly profitable price patterns: Master These 8 Bullish Patterns for Proven Profits.
I pay close attention to these price-volume relationships:
- Price Up–Volume Up (PUVU): This is bullish. It shows more interest in buying at higher prices.
- Price Up-Volume Down (PUVD): This can be bearish in an uptrend, suggesting weakening interest.
- Price Down–Volume Up (PDVU): In a downtrend, this might signal a trend change.
- Price Down–Volume Down (PDVD): This can suggest a slowing downtrend or a brief pause in an uptrend.
Here’s a visual of how I interpret volume in relation to price:

Indicators
The Relative Strength Index (RSI) is a tool I use to measure stock strength. It ranges from 0 to 100, with 0 being oversold and 100 being overbought. I find it useful for predicting trend changes through price divergences.
As a leading indicator, RSI can give me early signals about future price directions. Here’s how I use it:
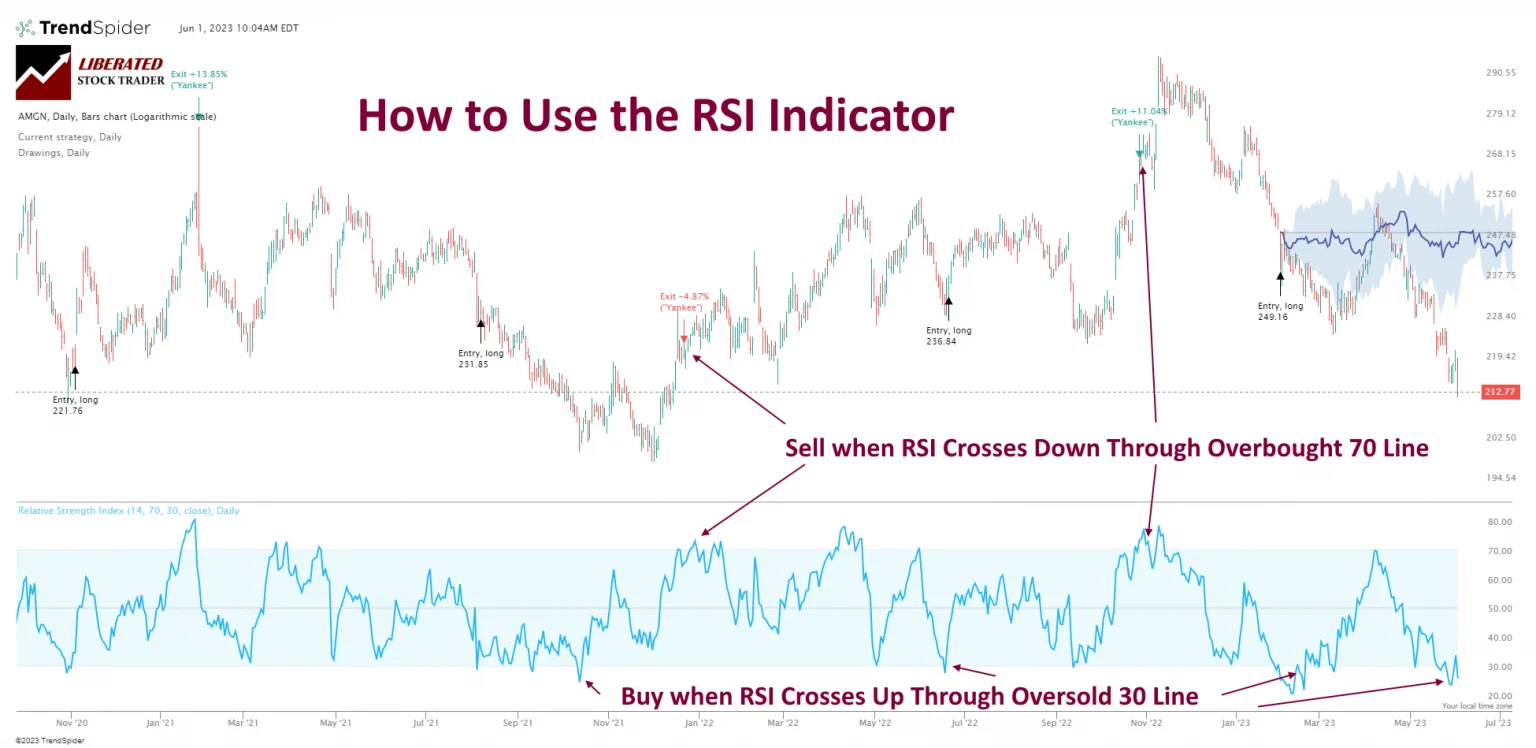
I look for:
- Overbought conditions (RSI > 70)
- Oversold conditions (RSI < 30)
- Divergences between RSI and price
These signals help me make informed trading decisions. For example, if I see the price making new highs but RSI failing to do so, it might indicate a weakening trend.
Technical analysis is a powerful tool in my trading toolkit. By combining price action, volume, and indicators like RSI, I can form a comprehensive view of market conditions and potential future moves. While no method is perfect, I find that technical analysis gives me valuable insights for timing my trades and managing risk.
Summary
Analyzing stocks is crucial for making smart investment decisions. For long-term investors like me, fundamental analysis is key.
I look at a company’s financial health, digging into balance sheets and income statements. This helps me gauge the stock’s true value and income potential.
Technical analysis, on the other hand, is more useful for short-term traders. It involves studying stock charts to predict future price movements. While I focus on fundamentals, I recognize the value of both approaches.