I’ve tested many candlestick and chart pattern recognition tools for trading stocks, currencies, cryptocurrencies, and other assets. These software programs can quickly scan and analyze huge amounts of market data to spot patterns that humans might miss. They’re especially useful for day traders who need to make fast decisions based on intraday price movements.
The top chart pattern recognition tools I found are TrendSpider, TradingView, and Finviz. These platforms use advanced algorithms to find chart patterns and candlestick formations across different timeframes.
They can analyze indices, ETFs, and individual stocks to give traders an edge. While no software is perfect, these tools can help spot potential trades and market trends more efficiently than manual analysis alone.
5 Best Cart Pattern Recognition Tools
- TrendSpider: Best features & flexibility
- TradingView: Great free pattern recognition
- Finviz: Simple free pattern scanning
- Tickeron: Good algo pattern detection
- MetaStock: Useful candle pattern strategy add-on
These programs help spot key formations on candlestick charts, such as hammers, double tops/bottoms, and triangle patterns. They make finding trade opportunities much easier.
Head-to-Head Comparison
TrendSpider wins for its all-around capabilities, including automated scanning for trendlines, candlesticks, and price patterns. It also allows backtesting and trading with bots. TradingView stands out for its powerful charts and automated candlestick recognition. It offers scanning for 28 different candlestick patterns, even in its free version.
| Pattern Recognition Tools | TrendSpider | TradingView | Finviz |
| Rating | 4.9 | 4.6 | 4.4 |
| Price/month | $74 | $0-$59 | $0-39 |
| # Candle Patterns Recognized | 150 | 40 | 11 |
| # Chart Patterns Recognized | 18 | 10 | 12 |
| Trendline Recognition | ✅ | ❌ | ✅ |
| Pattern Backtesting | ✅ | ✅ | ❌ |
| Visit | TrendSpider | TradingView | Finviz |
These tools help traders spot key chart patterns quickly. This can be useful for making trading decisions. Each platform has its strengths, so the best choice depends on a trader’s needs.
Pattern Recognition Tools Compared
I’ve found that TrendSpider stands out for automated pattern recognition across multiple timeframes. It spots trends, chart patterns, and candlestick formations with ease. TradingView offers the best free candlestick chart recognition globally, making it a great starting point for new traders. MetaStock’s candlestick trading system is robust, providing win/loss probabilities to help inform decisions.
These tools use complex algorithms to detect price patterns like Double Tops and candle patterns such as Dojis. They’re especially helpful for identifying candlestick patterns, which can be tricky for the human eye.
Here’s a quick comparison:
- TrendSpider: Best for automated multi-timeframe analysis
- TradingView: Top free option for candlestick recognition
- MetaStock: Strong for probability-based candlestick trading
I’ve noticed these platforms excel at interpreting market supply and demand through Japanese candlestick theory. They’re valuable for both novice and experienced traders looking to enhance their technical analysis and trading strategies.
1. TrendSpider: Winner Best Pattern Recognition Software
TrendSpider stands out as the top choice for pattern recognition software in the trading world. I’ve found its automated scanning and recognition capabilities to be truly impressive. It covers trendlines, candlesticks, price patterns, and Fibonacci levels across multiple timeframes.
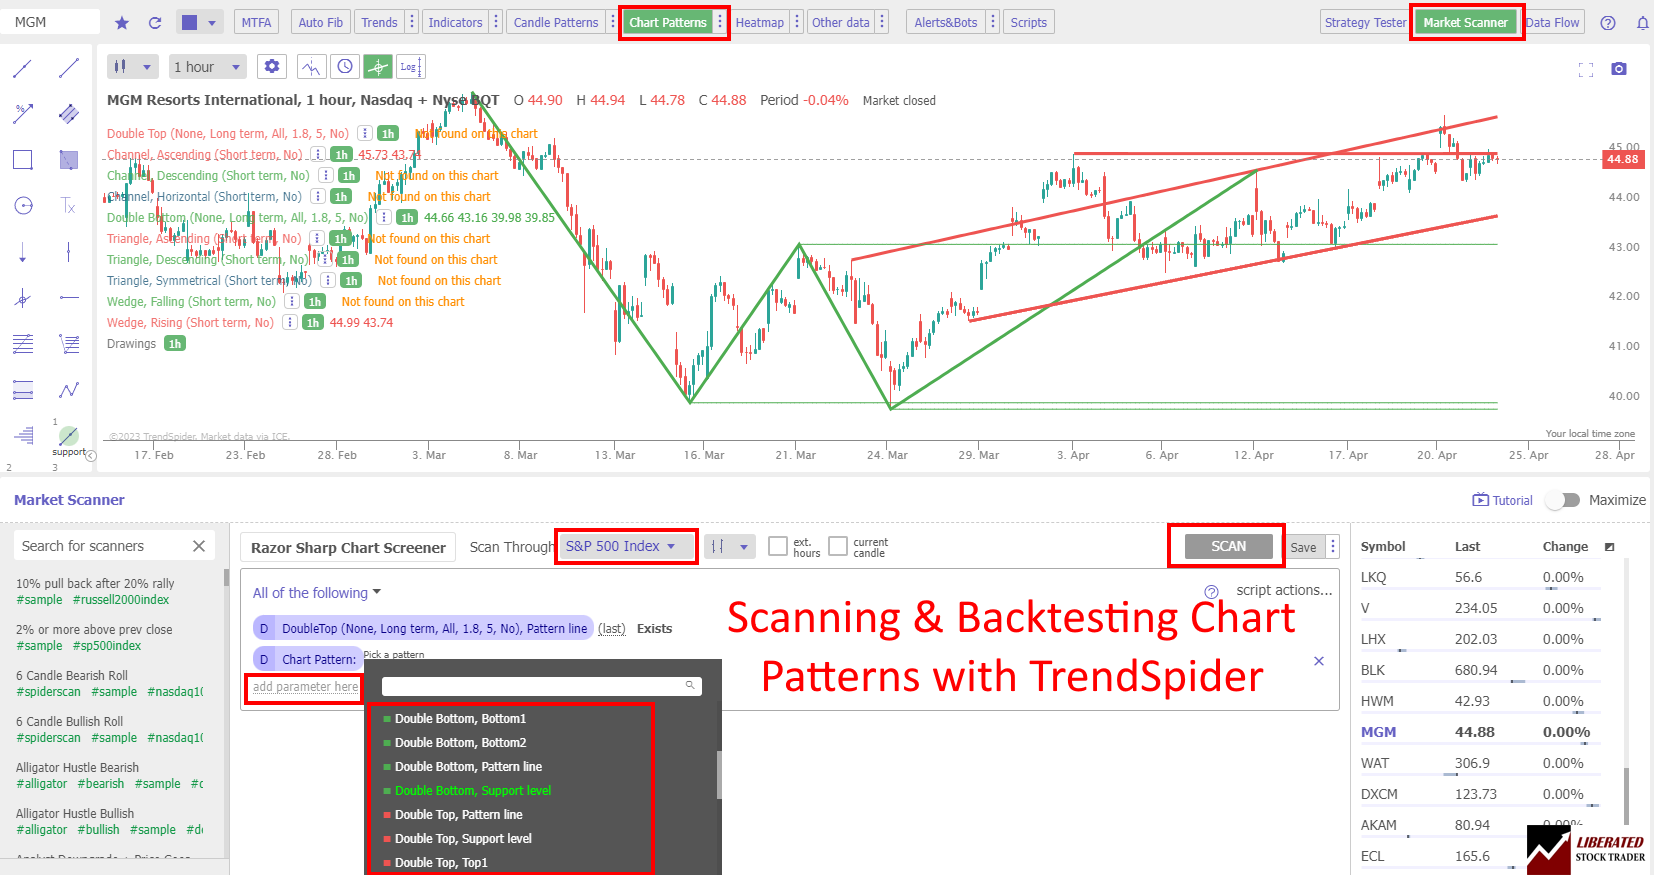
One of TrendSpider’s standout features is its ability to instantly detect stock chart support and resistance trendlines, 150 candlestick patterns, and Fibonacci numbers. This automation extends to market scanning, news analysis, and financial and technical screening across entire exchanges.
TrendSpider Rating: 4.8/5.0
| Pricing: ★★★★★ | News & Social: ★★★✩✩ |
| Software: ★★★★★ | Backtesting: ★★★★★ |
| Trading: ★★★★✩ | Pattern Recognition: ★★★★★ |
| Scanning: ★★★★★ | Candlestick Recognition: ★★★★★ |
| Charts & Analysis: ★★★★★ | Usability: ★★★★★ |
| Features | Rating ★★★★★ |
|---|---|
| Buy/Sell Signals | ✅ |
| Automatic Trade Execution | ✅ |
| Trendline Recognition | ✅ |
| Chart Pattern Recognition | ✅ |
| Candlestick Recognition | ✅ |
| Backtesting | ✅ |
| Code-Free Backtesting | ✅ |
| Auto-Trading Bots | ✅ |
| Markets Covered | USA |
| Assets | Stocks, Fx, Crypto, ETFs |
| Free Trial | ✅ |
| Community & Chat | ❌ |
| OS | Web Browser |
| Price | From $54/mo |
| Discount Available | Use Code “LST30” for -30% on monthly or -63% off annual plans |
I’ve compiled a list of pros and cons based on my experience with TrendSpider:
Pros:
- Automated Candlestick, Chart Pattern & Trendline Recognition
- Excellent Backtesting & Strategy Development
- 150+ Different Candlestick Patterns Recognized
- 220+ Charts & Indicators
- Multi-Timeframe Analysis
- Real-time Exchange Data Included in Price
- Supports Stocks, ETFs, Forex, Crypto, Indices & Futures
- Seasonality Charts
- News & Analyst Ratings Change Scanning
- In-Person 1-on-1 Training Included
Cons:
- No Social Community
- Not Ideal for Long-term Buy & Hold Investors
All plans include real-time data, futures, AI-powered pattern recognition, backtesting, news, options, crypto, and automated bot trading with broker integration.
I’ve got a tip for you: using the partner code LST30 at checkout will save you an additional 30% on your first year.
TrendSpider’s real-time candlestick charts tool is a game-changer. It recognizes over 150 patterns, which can be used for backtesting and auto-trading with Bots. What sets it apart is its ability to detect these patterns automatically across multiple timeframes on both intra-day and daily/weekly charts.
As a certified market analyst, I use TrendSpider’s AI automation to recognize and test chart patterns and indicators for reliability and profitability. Its automated trendline detection and plotting are incredibly accurate, often outperforming manual human analysis.
Key features that make TrendSpider stand out:
- AI-Powered Automated Chart Analysis: Transforms data into actionable trading insights
- Point-and-Click Backtesting: Tests any indicator, pattern, or strategy in seconds
- Opportunity Alerts: Turn backtested strategies into auto-trading bots
The multi-time-frame analysis feature is particularly useful. It allows you to view multiple timeframe charts on a single chart with trendlines plotted automatically. I also find the advanced plotting of support and resistance lines into a subtly integrated chart heatmap to be extremely helpful.

For volume analysis enthusiasts, TrendSpider offers Raindrop Charts, a unique and intuitive way to visualize volume profile or volume at price action.
When it comes to strategy backtesting, TrendSpider is unmatched. It provides comprehensive data on win rates, profitability, and drawdowns for trendlines, patterns, and indicators. I’ve personally backtested hundreds of indicators and chart patterns with TrendSpider, and the results have been invaluable for my trading strategies.
In my experience, TrendSpider’s automated pattern recognition capabilities are truly second to none. Whether you’re a day trader or a swing trader, the software’s ability to identify and analyze patterns across multiple timeframes can give you a significant edge in the market.
The platform’s user interface is intuitive and easy to navigate, even for those new to technical analysis. I appreciate how it streamlines chart analysis, saving time and reducing the risk of human error.
One of the most powerful features I’ve found is the ability to create custom alerts based on pattern recognition. This means you can be notified instantly when a specific pattern forms on any of your watched securities, allowing you to act quickly on potential trading opportunities.
TrendSpider’s backtesting capabilities are robust and flexible. You can easily test the performance of various patterns and indicators over different periods and market conditions. This feature has been instrumental in helping me refine my trading strategies and improve my overall performance.
Read the full TrendSpider test.
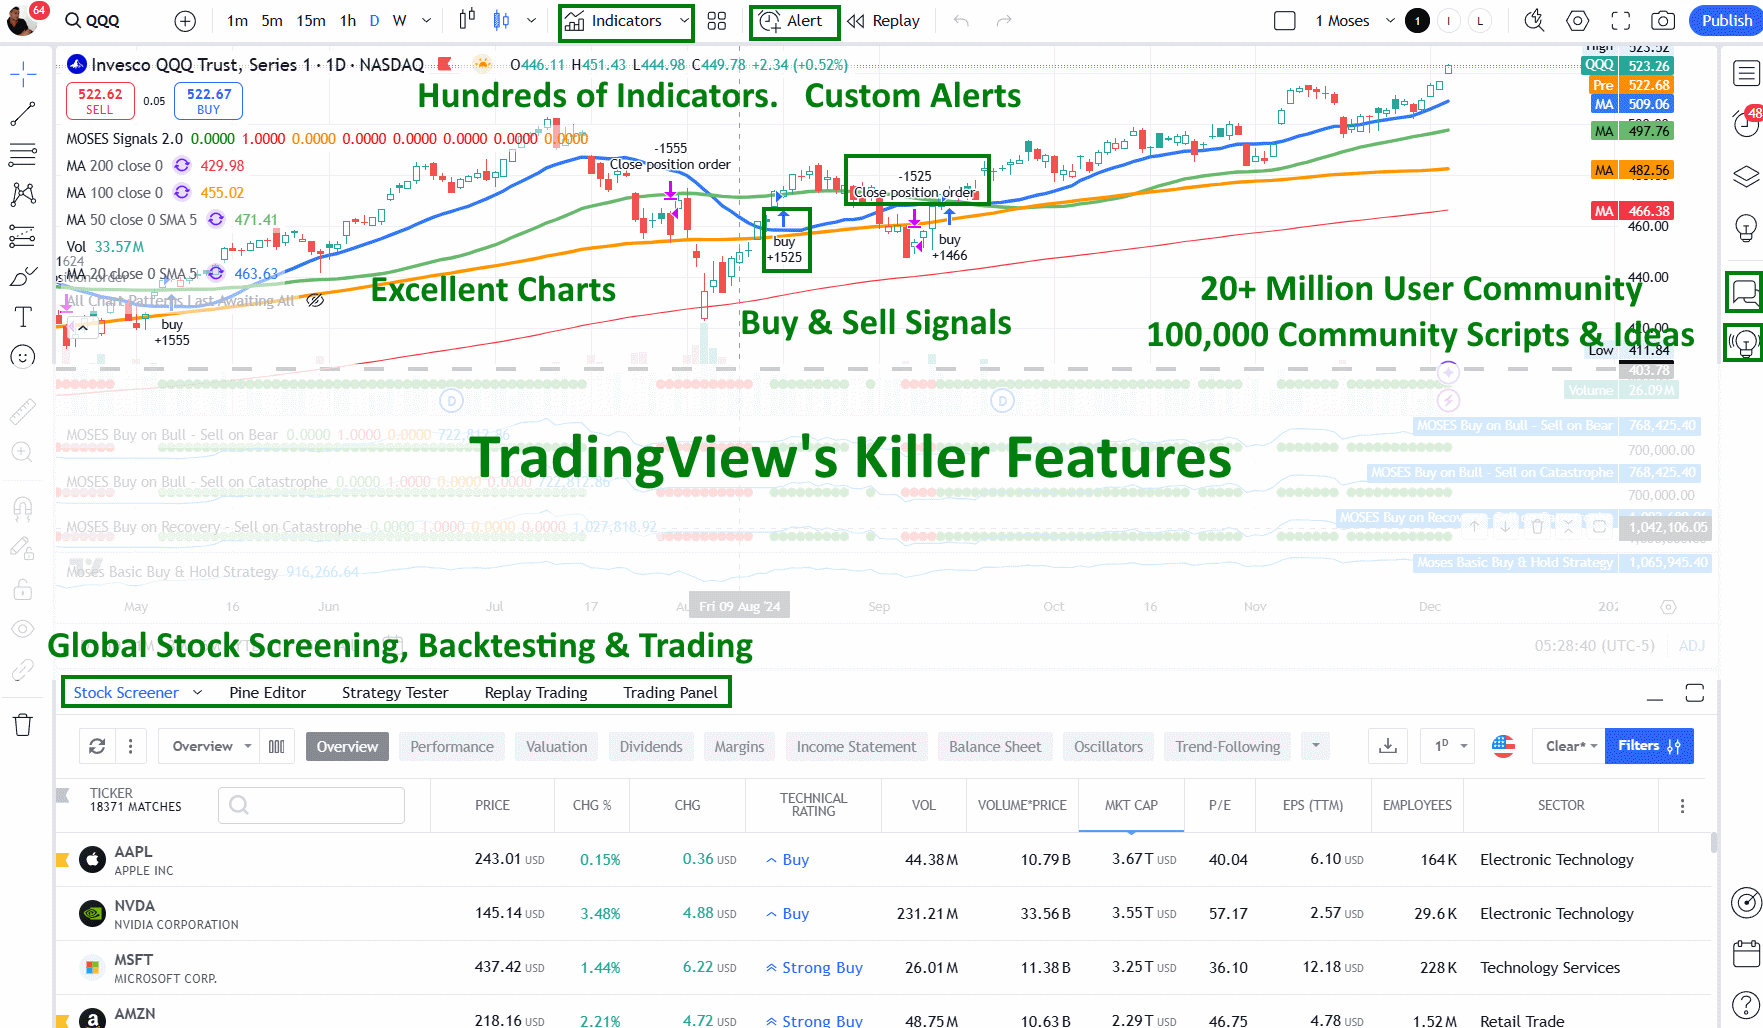
2. TradingView: Best Free Candle Pattern Analysis
TradingView is my go-to platform for candlestick pattern recognition. It offers free automated analysis for 39 different patterns across stocks, ETFs, forex, and cryptocurrencies. This global coverage is incredibly useful for diversifying my trading strategies.
TradingView gets my top rating! It’s hands down the best trading software out there, offering built-in broker integration, powerful backtesting tools, advanced scanners, and access to the world’s largest trading community. It’s a game-changer for traders at all levels!
TradingView Rating: 4.7/5.0
| Pricing: ★★★★★ | News & Social: ★★★★★ |
| Software: ★★★★★ | Backtesting: ★★★★✩ |
| Trading: ★★★★✩ | Pattern Recognition: ★★★★✩ |
| Scanning: ★★★★✩ | Candlestick Recognition: ★★★★★ |
| Charts & Analysis: ★★★★★ | Usability: ★★★★★ |
| Features | Rating ★★★★★ |
|---|---|
| Buy/Sell Signals | ✅ |
| Automatic Trade Execution | ✅ |
| Trendline Recognition | ✅ |
| Chart Pattern Recognition | ✅ |
| Candlestick Recognition | ✅ |
| Backtesting | ✅ |
| Code-Free Backtesting | ❌ |
| Auto-Trading Bots | ✅ |
| Markets Covered | Global, USA, India, Europe, Asia |
| Assets | Stocks, Crypto, Fx, ETFs, Futures |
| Free Trial | ✅ |
| Community & Chat | ✅ |
| OS | Web Browser, Windows |
| Price/Month | From $12.95 |
| Discount Available | $15 Discount & 16% Annual Plan Discount |
Pros:
- Large, active trading community
- 48 recognized candlestick patterns
- Beginner-friendly interface
- Excellent charting and analysis tools
- Global coverage, including cryptocurrencies and forex
- Solid stock screening capabilities
Cons:
- No real-time news feed
- No Options Trading
- No Point and Click Backtesting
The platform’s user-friendly interface makes it perfect for beginners. I can easily enable candlestick recognition by following these steps:
- Click on the Fx (Function Symbol) at the top of the page
- Select Candlestick Patterns
- Choose All Patterns or specific ones I want to see
What I love most about TradingView is how it visually highlights patterns on charts. For example, Bearish Engulfing patterns are marked in red with downward arrows, while Doji patterns are grey with upward arrows. This color coding helps me quickly spot potential trend changes.
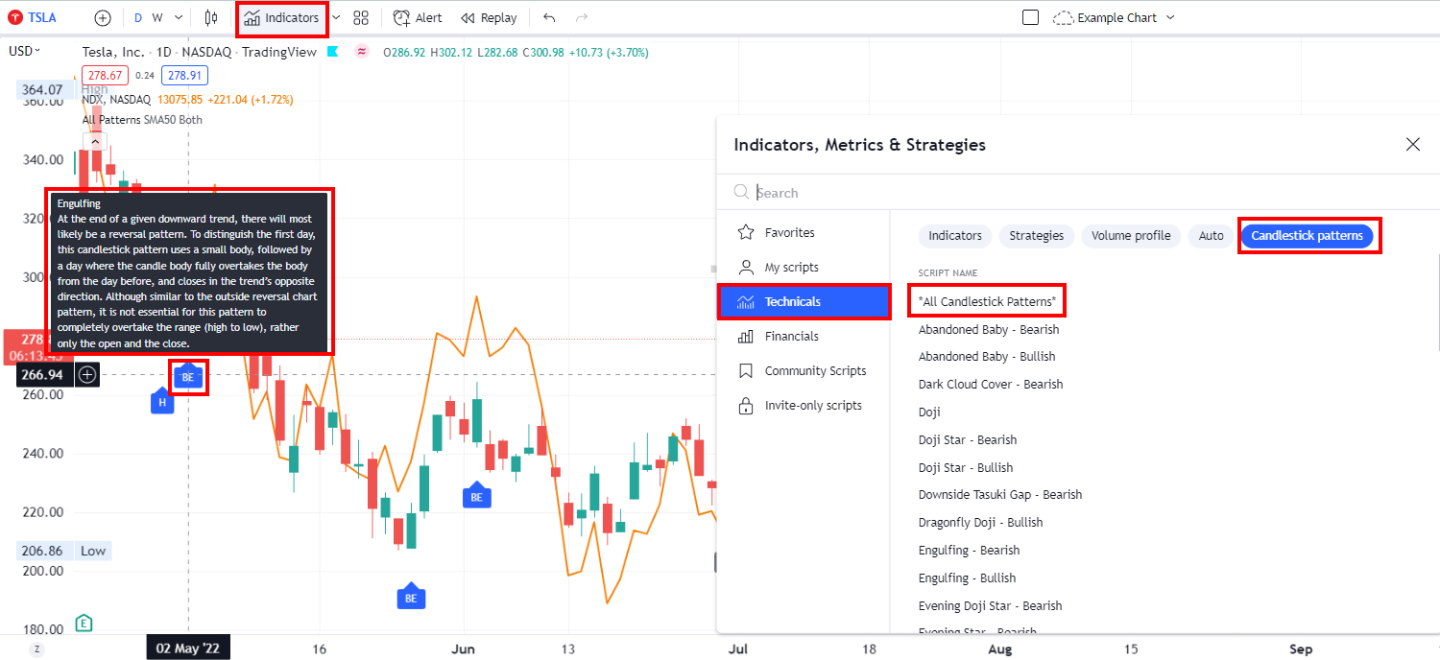
TradingView’s chart pattern recognition is just as impressive. To enable it:
- Click on Indicators
- Go to Technicals
- Select Auto
- Choose one or more chart patterns
The platform’s vast trading community is a goldmine of information. I often share my own charts and ideas and learn from others’ analyses. This social aspect, combined with powerful backtesting tools, creates a unique learning environment.
TradingView’s data coverage is mind-blowing. I can access information on every asset and stock market worldwide, and its charts and indicator selection are unparalleled.
Assets Covered
- Stocks
- ETFs
- Mutual funds
- Futures
- Forex
- Bonds
- Cryptocurrencies
Chart & Indicators
- LineBreak Charts
- Kagi Charts
- Heikin Ashi Charts
- Point & Figure Charts
- Renko Charts
- Candlestick Charts
- Broadest Selection of Indicators 200+
The fundamental scanning and screening tools are top-notch. I can filter and create watchlists based on a wide range of fundamental data. The platform even includes economic indicators like Federal Funds Rates and World Economic Growth.
The news and social features are well-integrated. I get feeds from Kiplinger, DailyFX, Futures Magazine, FXStreet, and StockTwits. This keeps me informed about market events and trends.
TradingView’s backtesting capabilities are impressive. With a premium subscription, I can create and sell my own trading systems. The community also offers many free indicators and systems to explore.
One limitation I’ve noticed is the lack of forecasting and automated trading features. For those, other platforms might be more suitable.
I appreciate how quickly I can get started with TradingView. There’s no need for credit card information, software installation, or complex data feed setup. It just works with a single click.
Here’s a quick rundown of TradingView’s pros and cons:
In my experience, TradingView stands out as an excellent choice for candlestick and chart pattern analysis. Its free tier offers substantial value, making it accessible to traders of all levels. The combination of powerful tools, global market coverage, and a vibrant community makes it a platform I use daily in my trading journey. Read the full TradingView review and test.
3. Finviz: Best Free Stock Chart Pattern Scanning
I’ve found Finviz to be an excellent tool for stock chart pattern scanning, especially for those on a budget. The free version offers impressive capabilities that are hard to match.
With Finviz, I can quickly and easily scan for 40 different stock chart patterns and candlesticks across U.S. stock markets. This makes it a great starting point for both new and experienced traders.
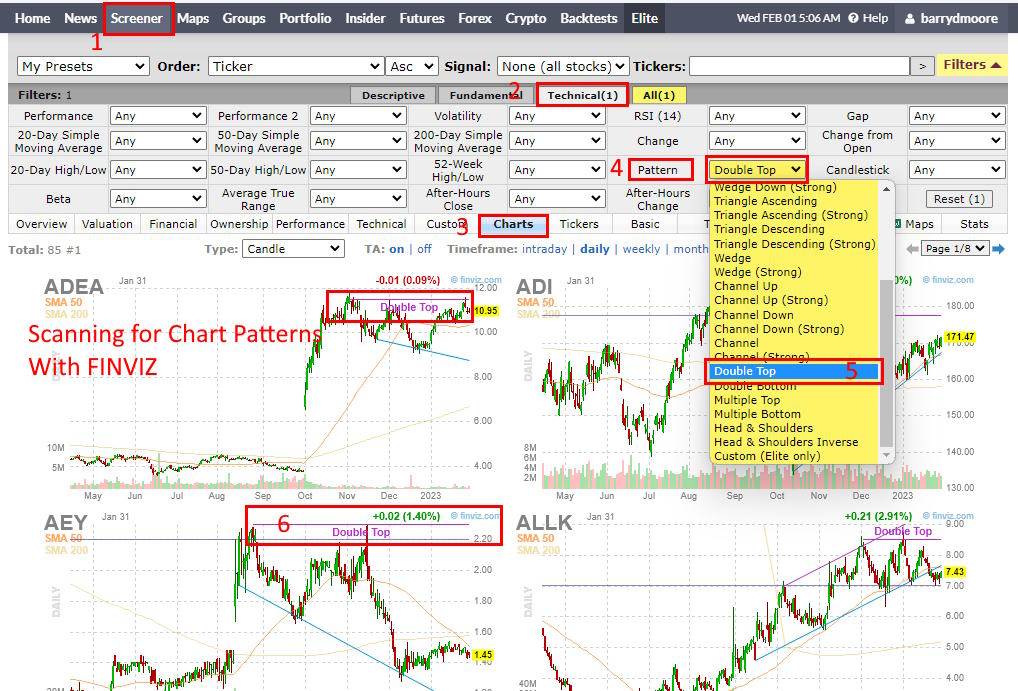
Here’s how I use Finviz to scan for chart patterns:
- Go to the Finviz website
- Click on “Screener”
- Select “Technicals”
- Click on “Charts”
- Open the “Patterns” drop-down menu
- Choose my desired patterns
The process is straightforward and takes just a few clicks. I appreciate how user-friendly Finviz is, even for beginners.
Finviz Rating: 4.4/5.0
| Pricing: ★★★★★ | News & Social: ★★★✩✩ |
| Software: ★★★★✩ | Backtesting: ★★★★✩ |
| Trading: ★★★✩✩ | Pattern Recognition: ★★★★✩ |
| Scanning: ★★★★✩ | Candlestick Recognition: ★★★★✩ |
| Charts & Analysis: ★★★★✩ | Usability: ★★★★★ |
| Features | Rating ★★★★✩ |
|---|---|
| Buy/Sell Signals | ❌ |
| Automatic Trade Execution | ❌ |
| Trendline Recognition | ✅ |
| Chart Pattern Recognition | ✅ |
| Candlestick Recognition | ✅ |
| Backtesting | ✅ With Elite |
| Code-Free Backtesting | ❌ |
| Auto-Trading Bots | ❌ |
| Markets Covered | USA |
| Assets | Stocks, ETFs |
| Free Trial | ✅ |
| Community & Chat | ✅ |
| OS | Web Browser, Windows |
| Price/Month | $25 |
| Discount Available | 40% Off with Annual Plan |
Finviz offers 67 stock screening metrics and 33 automated stock chart signals in its free version. This is quite generous compared to many other platforms. For those willing to pay, Finviz Elite expands this to 102 recognized stock chart patterns.
Pros
- Excellent heatmaps for market visualization
- Robust free stock screening tools
- Good insider trading information
- Ability to screen entire markets for patterns or candlesticks
- Good Backtesting in Elite Subscription
Cons
- Only nine chart overlays available
- 17 chart indicators on standard charts
- Limited cryptocurrency and Forex data
For those considering an upgrade, Finviz Elite offers some impressive features. I was particularly excited to try out the backtesting service. After spending several hours working with it, I can say it’s quite powerful. The backtester includes over 100 unique indicators and automatically detects stock chart patterns.
In my testing, I created a system based on the Money Flow Index that outperformed the S&P 500 over a 24-year period. My system achieved a profit of 1,588% with a 15.24% compounded annual return, compared to the S&P 500’s 10.86%.
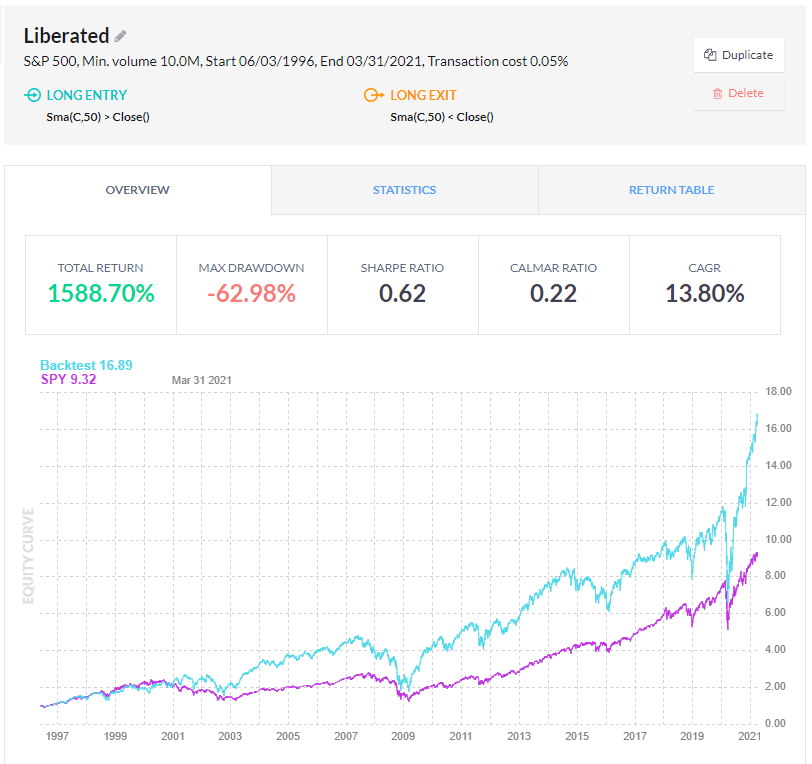
Finviz Elite is priced at $39.50 per month or $25 per month with an annual plan. It also has a 30-day money-back guarantee, which I think makes it a low-risk option to try out.
In my experience, Finviz strikes a great balance between functionality and ease of use. The free version provides solid chart pattern recognition, while Elite offers powerful backtesting capabilities. Whether you’re just starting or looking to refine your trading strategies, Finviz is definitely worth considering. Read the full Finviz review.
4. Tickeron: AI Stock Chart Patterns Recognition
Tickeron’s AI-powered chart pattern recognition is a game-changer for stock traders. I’ve found it particularly useful for identifying trading opportunities quickly and efficiently. The platform scans thousands of stocks, ETFs, forex pairs, and cryptocurrencies in real time, recognizing 40 different chart patterns.
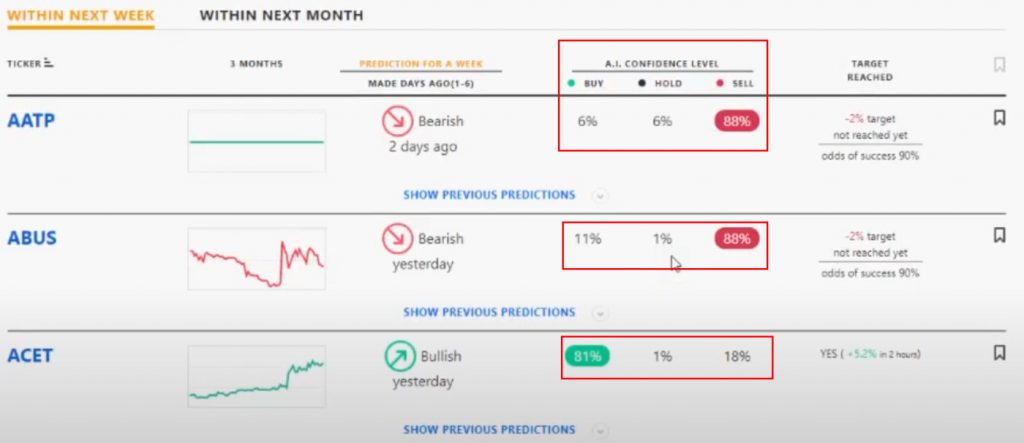
One of Tickeron’s standout features is its AI Confidence Level. This tool assigns a percentage to each trade prediction based on historical data, pattern success rates, and current market trends. For example, I’ve seen predictions like “88% chance of decline” for one stock and “81% chance of increase” for another. This gives me a clear idea of potential trade outcomes.
Tickeron Rating: 4.4/5.0
| Pricing: ★★★★★ | News & Social: ★★★✩✩ |
| Software: ★★★★★ | Backtesting: ★★★✩✩ |
| Trading: ★★★★✩ | Pattern Recognition: ★★★★✩ |
| Scanning: ★★★★★ | Candlestick Recognition: ★★★★✩ |
| Charts & Analysis: ★★★★✩ | Usability: ★★★★★ |
| Features | Rating ★★★★☆ |
|---|---|
| Buy/Sell Signals | ✅ |
| Automatic Trade Execution | ❌ |
| Trendline Recognition | ✅ |
| Chart Pattern Recognition | ✅ |
| Candlestick Recognition | ❌ |
| Backtesting | ✅ |
| Code-Free Backtesting | ❌ |
| Markets Covered | USA |
| Assets | Stocks, ETFs, forex, and cryptocurrencies |
| Free Trial | ❌ |
| Community & Chat | ❌ |
| OS | Web Browser |
| Price/Month | $125 |
| Discount Available | Get -50% off annual plans |
The platform’s user interface is straightforward:
- Select your preferred patterns
- Choose your market (stocks, ETFs, forex, crypto)
- View real-time results
I appreciate that Tickeron ranks patterns based on their potential success in current market conditions. This “Today’s Top Ranked Patterns” feature helps me focus on the most promising setups.
For those interested in backtesting, Tickeron offers a “Show previous predictions” option. This allows me to check the AI’s past performance for specific patterns and stocks, boosting my confidence in its predictions.
Pros
- Real-time pattern recognition for 40 chart patterns
- AI-driven trend prediction engines
- Investing portfolios with audited track records
- AI-assisted portfolio building
Cons
- Custom charting options are limited
- Users can’t plot their own indicators
- Complicated pricing
I find Tickeron particularly valuable for short-term traders who need quick, accurate market timing. The platform’s AI algorithms do the heavy lifting, scanning charts and identifying patterns that might take hours for a human to spot.
In my experience, Tickeron’s pattern recognition saves significant time when hunting for potential trade setups. It’s especially useful for swing and day traders who rely on precise market timing for their strategies.
However, it’s important to note that Tickeron’s approach leans heavily on AI algorithms rather than manual chart analysis. If you prefer to draw your own trendlines or add custom indicators, you might find the platform limiting. But for traders who want to leverage AI for pattern recognition and trade predictions, Tickeron offers a powerful suite of tools. Read the full Tickeron review.
5. MetaStock: Candlestick Pattern Trading Tool
The combination of MetaStock’s advanced technical analysis and Greg Morris’s candlestick pattern recognition is great! Together, they create a cutting-edge stock trading system that predicts the probable win ratio of each pattern. With this dynamic duo, you’ll have a systematic, reliable strategy for buying and selling using candlestick patterns. Take your trading game to the next level!
MetaStock is a leading name in stock market analysis software, known for its comprehensive global data and extensive market coverage. From equities and futures to forex, ETFs, and options, MetaStock caters to a wide range of trading needs with speed and reliability.
What sets MetaStock apart from other providers is its locally installed software, offering the option to purchase one-time licenses and avoid recurring monthly fees. Additionally, MetaStock features a marketplace where professional traders can sell custom trading systems and signals as add-ons, allowing users to expand the platform’s functionality.
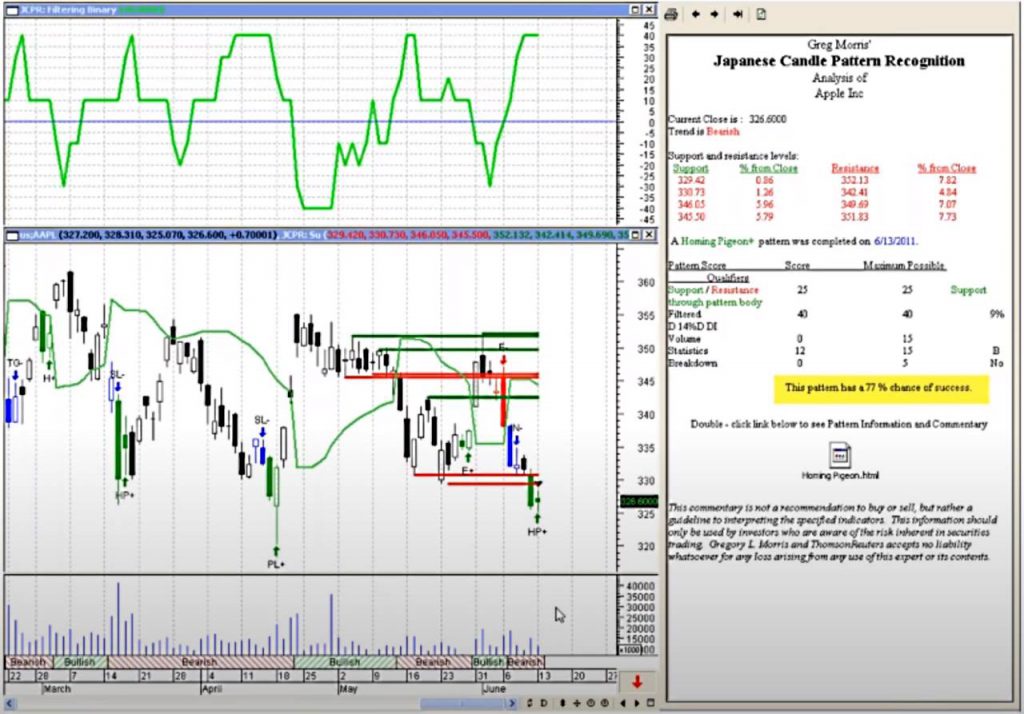
While MetaStock doesn’t include built-in candlestick pattern recognition, traders can access this capability by purchasing the “Greg Morris’ Japanese Candle Recognition” add-on for a one-time fee of $349. Greg Morris, a globally recognized authority on Japanese candlestick trading, brings his expertise to this add-on, which is based on his extensive research and publications.
MetaStock Rating: 4.4/5.0
| Pricing: ★★★★★ | News & Social: ★★★★★ |
| Software: ★★★★★ | Backtesting: ★★★✩✩ |
| Trading: ★★★★✩ | Pattern Recognition: ★★★✩✩ |
| Scanning: ★★★★★ | Candlestick Recognition: ★★★✩✩ |
| Charts & Analysis: ★★★★★ | Usability: ★★★✩✩ |
| Features | Rating ★★★★✩ |
|---|---|
| Buy/Sell Signals | ✅ |
| Automatic Trade Execution | ❌ |
| Trendline Recognition | ❌ |
| Chart Pattern Recognition | ❌ |
| Candlestick Recognition | ✅ |
| Backtesting | ✅ |
| Code-Free Backtesting | ❌ |
| Auto-Trading Bots | ❌ |
| Markets Covered | Global, USA, India, Europe, Asia |
| Assets | Stocks, Fx, ETFs, Futures |
| Free Trial | ❌ |
| Community & Chat | ❌ |
| OS | Windows Only |
| Price/Month | From $265 |
| Discount Available | 30 Day Real-Time Free Trial |
This add-on provides a sophisticated trading system equipped with advanced candlestick backtesting, detailed analysis, and actionable signals. It forecasts potential stock price movements and assigns a probability rating to the success of each candlestick signal—a feature that is unique and invaluable to traders.
The probability rating is a standout aspect of the system, offering insights and precision that no other trading software currently matches. For those seeking a professional-grade trading system, this add-on delivers unparalleled value and expertise. Read more in my MetaStock Review.
Summary
TrendSpider offers robust backtesting, candlestick analysis, and interpretation on multiple timeframes. TradingView has the best free candlestick charting and recognition for global stock/Forex markets. Finally, MetaStock offers a powerful candlestick trading system with buy signals and win probabilities for professional traders. They are all excellent solutions; the choice is yours.