I want to talk about a key investing principle that can help you make smarter decisions with your money. It’s called the margin of safety, and it’s a concept Warren Buffett swears by.
The margin of safety is used to find stocks that are priced below their true value. By buying undervalued companies, you give yourself some wiggle room if things don’t go exactly as planned.
I’ll explain how to calculate it using cash flow projections and intrinsic value. This simple but powerful tool can boost your investing results over the long run.
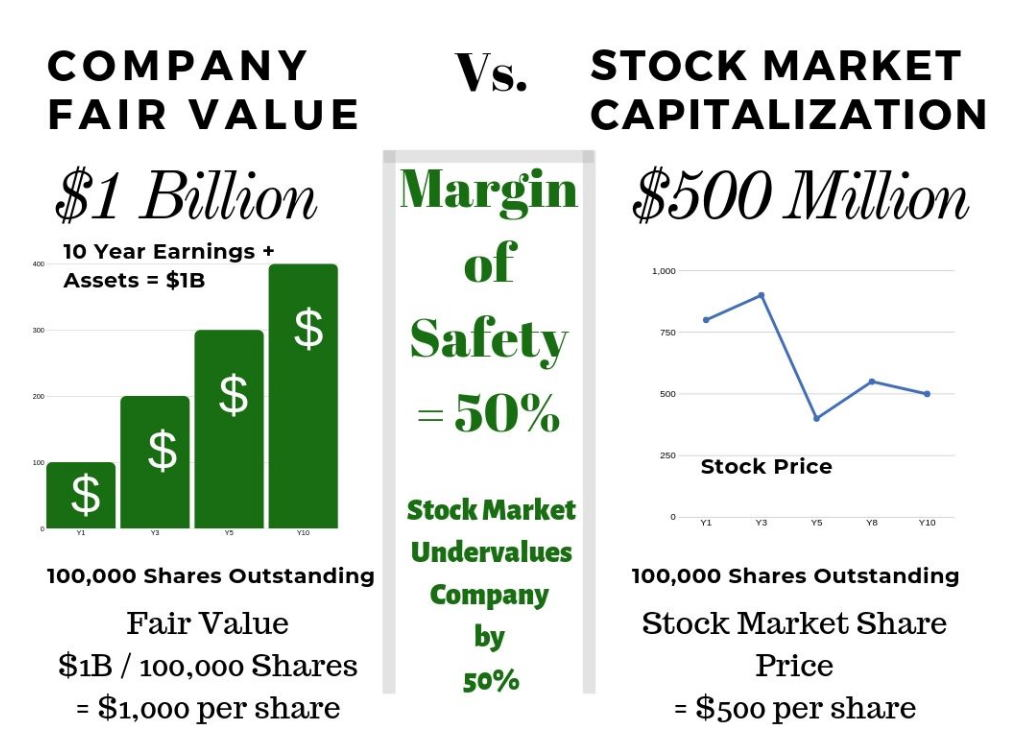
Infographic: Calculating the Margin of Safety
The image below breaks down the margin of safety calculation clearly:
The formula is:
(Current Sales – Break-Even Point) / Current Sales x 100
This gives you the margin of safety as a percentage. It tells you how much sales can drop before reaching the break-even point.
Understanding the Margin of Safety
The margin of safety is a key concept in value investing that I find fascinating. It is the difference between a company’s true worth and its current stock price.
If a company’s intrinsic value is $100 per share, but it’s trading at $80, the margin of safety is 25%. This gives investors a cushion against potential losses.
To calculate intrinsic value, I look at a company’s estimated cash flows over the next 10 years, adjusted for inflation. This method, known as discounted cash flow (DCF), helps me gauge a stock’s real value.
Value investing legends like Warren Buffett and Seth Klarman swear by this principle. Here’s why it’s so effective:
- Risk reduction
- Potential for higher returns
- Peace of mind for investors
Let me break it down with an example:
| Company X | Value |
|---|---|
| Fair value | $10/share |
| Current price | $5/share |
| Margin of safety | 50% |
In this case, if I buy at $5, I have a 50% margin of safety. The stock price could potentially double to reach its fair value.
I always remember that the stock market doesn’t always reflect a company’s true worth. When I find a stock trading below its fair value, that gap is my margin of safety. The bigger this gap, the better protected I am against potential losses.
For me, the margin of safety is like a safety net in investing. It helps me manage risk and spot opportunities where the market might be undervaluing a company. By focusing on stocks with a healthy margin of safety, I aim to invest more confidently and potentially boost my returns over time.
Warren Buffett’s Formula for Valuing a Business
Warren Buffett’s approach to business valuation revolves around the concept of margin of safety. This key principle in value investing helps protect against potential losses. Buffett suggests buying stocks at a significant discount to their intrinsic value. The formula is simple:
Margin of Safety = 1 – (Market Price / Intrinsic Value) * 100
For example:
- Intrinsic Value: $100
- Market Price: $70
- Margin of Safety: 30%
Buffett might apply a 50% discount in some cases. The bigger the gap between price and value, the safer the investment. This cushion is especially important for businesses that are more vulnerable to economic changes or competition. I think of it like driving a heavy truck across a bridge – the wider and stronger the bridge, the more comfortable I’d feel.
Margin of Safety Formula
The margin of safety formula helps me assess a stock’s potential. It’s:
(Intrinsic Value – Stock Price) / Intrinsic Value
This calculation shows how much a stock price could drop before reaching its intrinsic value. A higher percentage indicates a safer investment with more room for error.
I use this formula to guide my stock picks and reduce risk in my portfolio. It’s a key tool for value investing.
How to Calculate the Margin of Safety Ratio for Small Businesses
Calculating the margin of safety ratio is crucial for small businesses. This ratio helps me understand how much sales can drop before a company starts losing money. To figure it out, I use this formula:
Margin of Safety Ratio = (Actual Sales – Break-even Sales) / Actual Sales
Let’s break this down:
- Actual Sales: The total revenue a business brings in
- Break-even Sales: The point where total revenue equals total costs
For example, if a small bakery has:
- Actual Sales: $100,000
- Break-even Sales: $80,000
The calculation would be:
($100,000 – $80,000) / $100,000 = 0.2 or 20%
This means the bakery has a 20% margin of safety. They could lose up to 20% of their sales before they start losing money.
A higher ratio is better. It shows the business has more room to handle drops in sales. I always aim for a margin of safety above 10% for small businesses I work with.
To boost this ratio, I focus on two main areas:
- Increasing sales volume
- Cutting fixed costs
By tweaking these factors, I can help small businesses build a stronger safety net. This gives them more breathing room in tough times and sets them up for long-term success.
Margin of Safety Formula in Excel
I can easily calculate the margin of safety using Excel or Google Sheets. The formula is simple and only requires two key inputs: intrinsic value and market price.
To set up the calculation, I put the intrinsic value in cell B2 and the market price in cell B3. Then, I use this formula in cell B4:
=SUM(1-(B3/B2))*100
This calculates the margin of safety as a percentage.
Example in Excel
Here’s a quick example of how I’d set it up:
| A | B |
|---|---|
| Intrinsic Value | 150 |
| Market Price | 100 |
| Margin of Safety (%) | =SUM(1-(B3/B2))*100 |
When I enter these values, Excel calculates a 33.33% margin of safety. This means the stock price could fall by up to 33.33% before reaching its intrinsic value.
How to Calculate the Margin of Safety for Stocks
I calculate the margin of safety for stocks by estimating future cash flows and comparing them to the current stock price. First, I project free cash flows for 10 years and discount them for inflation. Then, I divide the total by outstanding shares to get intrinsic value per share. The gap between this intrinsic value and the market price is my margin of safety.
The Margin of Safety Formula Percentage
I calculate the margin of safety percentage by comparing a stock’s current price to its fair value. For example, if a stock trades at $10 but I estimate its fair value at $5, the margin of safety is 50%. This gives me a buffer against potential losses. To find the percentage, I subtract the fair value from the current price, divide by the current price, and multiply by 100.
Get Your Free Margin of Safety Calculator in Excel
I’ve created a handy Excel tool to help you calculate the margin of safety for stocks. It’s simple to use and handles all the complex variables for you. Just input the key data, and the spreadsheet does the rest. Want to try it out? Click the link below to get your free copy now.
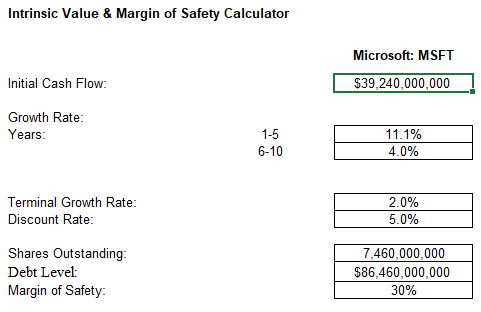
How to Calculate Intrinsic Value Using Excel
I’ll explain how to calculate the margin of safety in Excel. This process helps determine a stock’s intrinsic value and potential investment worthiness.
- Find the free cash flow for the first year.
- Multiply it by the expected growth rate.
- Calculate the Net Present Value (NPV) by dividing the result by the discount rate.
- Project cash flows for 10 years, repeating steps 1-3 for each year.
- Sum up all the NPVs.
- Multiply the 10th year by 12 to get the sell-off value.
- Add the results from steps 5 and 6 to get the company’s total intrinsic value.
- Divide by the number of outstanding shares for the intrinsic value per share.
The margin of safety is the percentage difference between the intrinsic value per share and the current stock price.
I find this method useful because it’s straightforward. However, I’ve noticed that free cash flow can change significantly from year to year, which might affect accuracy.
Here’s a simple table to help visualize the process:
| Year | Free Cash Flow | Growth Rate | NPV |
|---|---|---|---|
| 1 | $1,000,000 | 5% | $952,381 |
| 2 | $1,050,000 | 5% | $952,381 |
| … | … | … | … |
| 10 | $1,551,328 | 5% | $952,381 |
To make this easier, I use Excel functions like NPV and GROWTH to speed up calculations.
The Margin of Safety: Determining the Right Price for a Stock
After finding the intrinsic value per share, I compare it to the current market price. If the intrinsic value is higher, I consider it a potential value investment.
I aim for a margin of safety over 30%. This means the stock price could drop by 30%, and I’d still break even. It’s a buffer against potential losses.
For example:
- Intrinsic value: $100
- Current price: $70
- Margin of safety: (100 – 70) / 100 = 30%
I keep in mind that the margin of safety is just an estimate. It doesn’t account for all risks like:
- Political changes
- New regulations
- Tech breakthroughs
- Natural disasters
- Market trends
The margin of safety I choose depends on my risk tolerance. If I’m cautious, I go for a higher margin. If I’m more daring, I might accept a lower one.
I use Excel to track these calculations for multiple stocks:
- Column A: Stock ticker
- Column B: Intrinsic value
- Column C: Current price
- Column D: Margin of safety formula (=(B2-C2)/B2)
This helps me quickly compare different investment options.
I also look at other factors like:
- Assets on the balance sheet
- Past and projected cash flows
- Industry trends
By combining these with my margin of safety calculations, I get a clearer picture of a stock’s potential value. Remember, this method isn’t perfect. It’s just one tool in my investing toolkit. I always do more research before making any investment decisions.
Understanding and Applying the Margin of Safety Ratio
The Margin of Safety Measures Market Irrationality
I’ve found that the margin of safety ratio can be a powerful tool for measuring market irrationality. When the ratio is large, it often indicates that the market has become detached from a company’s true value. For example, if a business has $5 billion in assets and future cash flows, but its market cap is only $2.5 billion, that’s a 50% discount. This gap shows the market might be acting irrationally.
News and popular opinion can drive this irrationality. I’ve noticed that some investors, like Warren Buffett, actually look for negative news about good companies. They know that news reports are often shallow and focus on just one aspect of a business. This can create buying opportunities.
Many value investors prefer “boring” stocks over flashy ones. They believe people overpay for attractive or trendy companies. An oil company might be less exciting than a tech startup, but it could be more profitable. Smart investors look past the surface to find hidden value.
Buffett’s strategy involves getting more accurate information than other investors. He reads financial reports instead of relying on news articles or blogs. This gives him an edge in valuing companies correctly.
A High Margin of Safety
I’ve learned that while a high margin of safety is generally good, there can be too much of a good thing. A reasonable margin of safety usually falls between 20% and 55%. If it’s much higher than that, it might be a red flag.
An extremely high margin of safety could mean the company has serious problems. These might include:
- Industry disruption
- A major scandal
- Impending bankruptcy
If you see a margin of safety above 55%, it’s crucial to dig deeper. Hidden issues could explain the large discount.
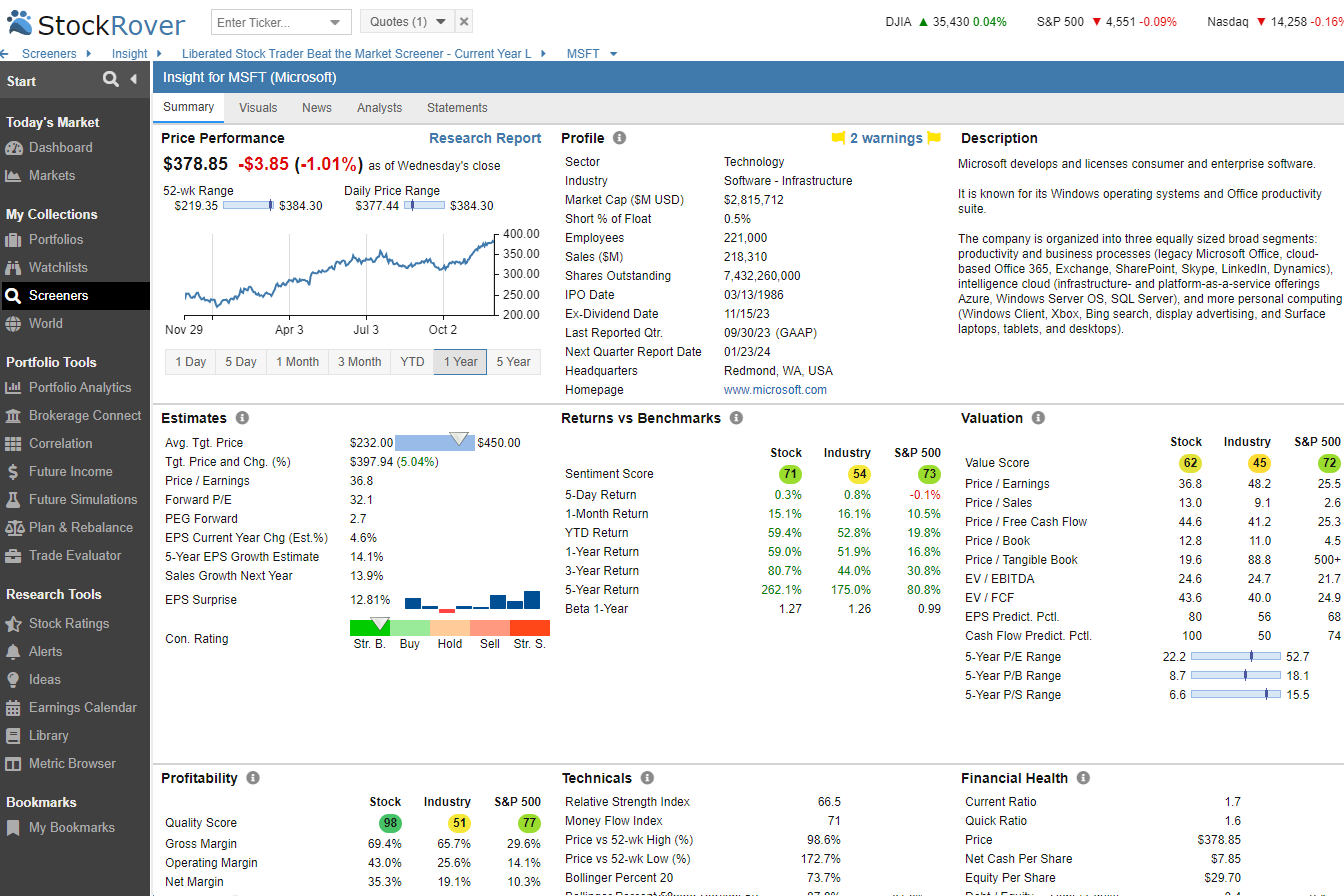
A Margin of Safety Stock Screener
I’ve found Stock Rover to be one of the best tools for calculating the margin of safety. For further information, please read my Stock Rover review. It offers three key ratios:
- Basic margin of safety
- Margin of safety with enterprise value to sales
- Fair value (standard and academic)
These different calculations can help confirm if a stock is truly undervalued.
Let’s look at an example:
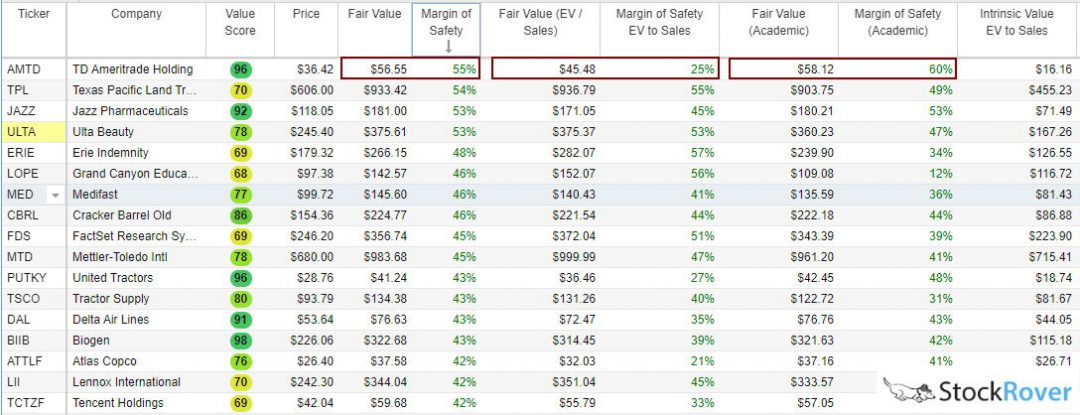
This image shows how Stock Rover calculates fair value in three ways. The red boxes highlight that while there are some differences, the outcomes are often similar.
Using multiple methods can give you more confidence in your valuation.
I find it helpful to use all three calculations when assessing a stock. If they all point to undervaluation, it’s a stronger signal than relying on just one method.
Remember, the margin of safety is just one tool in your investing toolkit. It’s most effective when combined with other forms of analysis. Look at factors like:
- The company’s balance sheet
- Cash flow statements
- Industry trends
- Management quality
By considering all these elements, you can make more informed investment decisions. The margin of safety ratio helps you quantify the potential upside, but it’s not the whole story.
When using a stock screener, I like to set up filters for:
- Minimum margin of safety (e.g., 20%)
- Maximum margin of safety (e.g., 55%)
- Positive cash flow
- Low debt-to-equity ratio
- Consistent revenue growth
This helps me find potentially undervalued stocks with strong fundamentals, which is a good starting point for further research.
I’ve found that patience is key when using the margin of safety approach. Sometimes, it can take time for the market to recognize a company’s true value. But by buying at a discount, you give yourself a cushion and increase your potential returns.
It’s also important to regularly reassess your investments. A stock’s margin of safety can change as new information becomes available or market conditions shift. I periodically review my portfolio and periodically recalculate the margin of safety for each holding.
Summary
The margin of safety is a key concept in value investing. Here are six ways I calculate it using Stock Rover:
- Fair Value (DCF): Uses discounted cash flow analysis to find intrinsic value
- Margin of Safety: Percentage difference between fair value and price
- Fair Value (EV/Sales): Alternative when DCF isn’t possible
- Margin of Safety (EV/Sales): Based on EV/Sales fair value
- Fair Value (Academic): Uses perpetual cash flow projections
- Margin of Safety (Academic): Based on academic fair value
Each method has strengths and weaknesses. I often compare multiple calculations for a more complete picture.
Here’s a simple comparison table:
| Method | Based On | Strength | Weakness |
|---|---|---|---|
| DCF | Cash flows | Comprehensive | Assumptions sensitive |
| EV/Sales | Sales multiples | Simple | Less precise |
| Academic | Perpetual growth | Long-term view | May overestimate growth |
Remember, the margin of safety isn’t just about numbers. It’s a mindset of caution and value-seeking in investing.
To calculate the margin of safety effectively, you need good data and tools. Stock screeners like Stock Rover can help, but your own analysis and judgment are crucial.
The margin of safety isn’t just about avoiding losses. It’s about maximizing long-term gains by buying quality assets at discounted prices. This approach has served value investors well for decades.
FAQ
How do you find a margin of safety?
I use stock screening tools like Stock Rover to easily find margin of safety values for different stocks. You can also calculate it manually by comparing a stock’s current market price to its estimated intrinsic value. This helps determine if a stock may be undervalued or overvalued.
How do you calculate the margin of safety in dollars?
To calculate the margin of safety in dollars, I subtract the current market price from the estimated intrinsic value.
For example, if I estimate a stock’s intrinsic value at $50 per share and it’s trading at $40, the margin of safety is $10 per share.
Is a higher margin of safety good?
I find that a higher margin of safety is generally better for investors. It indicates a stock may be more undervalued, potentially offering greater upside with less downside risk. However, extremely high margins of safety may signal problems with the stock that need investigation.
Can the margin of safety be negative?
Yes, the margin of safety can be negative if a stock’s market price exceeds its estimated intrinsic value. A negative margin signals potential overvaluation and higher investment risk.
What are the main factors that affect the margin of safety?
Several key factors influence the margin of safety:
-Company fundamentals (revenue, earnings, debt levels)
-Industry trends and competitive position
-Economic conditions (GDP growth, inflation, interest rates)
-Market sentiment and investor psychology