I’ve been using Finviz for over a decade, and I’m excited to share my thoughts on this popular stock screening and analysis tool. As a long-time trader, I’ve seen Finviz grow and change over the years. It’s come a long way since I first started using it!
My Finviz testing uncovered an impressive free stock screener, speedy market heatmaps, and automated chart pattern recognition! Plus, with Finviz Elite, you gain access to real-time data, interactive charts, and backtesting—all at a competitive price.
In this article, I’ll examine Finviz’s current offerings, starting with its free offering and then exploring its premium Elite features, such as real-time data and backtesting. Let’s see how Finviz compares to other top financial tools!
Test Results
I tried out Finviz and gave it high marks overall. The pricing is great – 5 stars! The software works well, though there’s a tiny bit of room for improvement. I found the screening tools really useful for finding stocks. The charts look good and help analyze market trends.
Finviz Rating: 4.4/5.0
| Pricing: ★★★★★ | News & Social: ★★★✩✩ |
| Software: ★★★★✩ | Backtesting: ★★★★✩ |
| Trading: ★★★✩✩ | Pattern Recognition: ★★★★✩ |
| Scanning: ★★★★✩ | Candlestick Recognition: ★★★★✩ |
| Charts & Analysis: ★★★★✩ | Usability: ★★★★★ |
| Features | Rating ★★★★✩ |
|---|---|
| Buy/Sell Signals | ❌ |
| Automatic Trade Execution | ❌ |
| Trendline Recognition | ✅ |
| Chart Pattern Recognition | ✅ |
| Candlestick Recognition | ✅ |
| Backtesting | ✅ With Elite |
| Code-Free Backtesting | ❌ |
| Auto-Trading Bots | ❌ |
| Markets Covered | USA |
| Assets | Stocks, ETFs |
| Free Trial | ✅ |
| Community & Chat | ✅ |
| OS | Web Browser, Windows |
| Price/Month | $25 |
| Discount Available | 40% Off with Annual Plan |
Finviz does a nice job with pattern and candlestick recognition. These features helped me spot potential trade setups. The backtesting capabilities are solid, and I had no trouble using the site – it’s very user-friendly.
The trading signals and news features were decent but not outstanding. Still, Finviz offers a lot of value for stock analysis and research.
My Verdict
I love Finviz’s free tools! The heatmaps and stock screener are super handy. They keep making the charts better, too. For $299 a year, Finviz Elite gives you real-time data and backtesting. It’s a good deal if you trade a lot. I think Finviz is great for both new and experienced investors who want solid charting without breaking the bank.
Top Features
It has handy screening tools to find stocks and a heatmap to see market trends at a glance. The charts help me visualize price movements. I really like the pattern and signal alerts – they catch things I might miss. The auto-trendlines are neat too.
It’s great for new investors who are just learning. You can try it for free to see if you like it. They offer a 30-day refund if you are not happy. The yearly plan gives a big 40% discount, too. Right now, though, it’s only for US users.
Pros
- 67 ways to filter stocks
- Spots 33 different chart patterns
- Free version is one of the best out there
- Quick and easy to see how sectors are doing
- Grabs news from all over the place
- Can test strategies using 102 chart patterns
Cons
- Paid version’s testing could be more flexible
- Only 21 chart indicators
- No phone app
I love how Finviz keeps getting better. The charts and maps are informative, and it’s super easy to use. Even though it’s not perfect, it’s still one of my go-to tools for checking out stocks.
How Does It Stack Up?
I’ve looked at a few similar products to see how they compare. TrendSpider seems to be the best choice for automated chart analysis, backtesting, and bot trading. If you want a global trading community, TradingView might be a better fit. For long-term growth, dividend, and value investing, Stock Rover offers more than Finviz. Trade Ideas is great for AI-driven day trading. And if you need real-time news for trading, Benzinga Pro could be a good pick. MetaStock’s backtesting tools are super helpful. Finally, TC2000 is a good option for US traders seeking better charts, especially for Options trading.
Cost Options
Free Version
I like that Finviz offers a free option. It’s great for new investors who want to check stocks without spending money. You can look at over 10,000 stocks, use charts, and see news. The only downside is you’ll see some ads.
Sign-Up Option
I think it’s smart to sign up for a free Finviz account so you can save your settings, which is handy. Plus, you can set up 50 portfolios with 50 stocks each.
Elite
For $39.99 a month, or $24.96 if you pay for a year, you can get Finviz Elite. It’s pretty cool – you get real-time data, alerts you can customize, and more detailed charts. You can also backtest how well your stock picks might do. If you want to dig deeper into company finances, you can look back eight years.
| Finviz Plan | Cost | Features |
|---|---|---|
| No-Cost | Free | Basic stock screening, delayed data |
| Sign-Up | Free | Save settings, 50 portfolios |
| Elite | $24.96-$39.99/mo | Real-time data, alerts, advanced tools |
I think the Finviz Elite choice is worth it if you’re serious about investing. But the free options are great for getting started or casual use.
Get a Deal on Finviz Elite
While Finviz doesn’t offer coupon codes, new customers can grab a sweet 40% off deal on a 1-year Elite subscription. That’s a nice chunk of savings for access to their stock research tools.
The Finviz Experience
I love how easy Finviz is to use. I just opened my browser, and I’m good to go—no downloads needed!
When I log in, I see a detailed dashboard that shows me how the market is doing today. I also spot the top movers, the latest news, and big insider trades right away. It’s pretty handy!
My Mobile App Experience
I tried to find a Finviz stock app on my phone, but there isn’t one. Some folks might grab the FINWIZ app by mistake. It’s not the same thing at all! I find Finviz works best when I use it on my computer or tablet. The website does the job just fine for me.
Testing Finviz Features
The best way to start is with the heatmaps or screener. Let’s begin with the heatmap feature. Heatmaps give a quick visual snapshot of market trends. They use colors to show how different stocks or sectors are doing. Red usually means prices are down, while green shows they’re up.
The screener is another great tool. It helps you find stocks that match your criteria. You can set filters for things like price, industry, or performance.
Stock Market Heat Maps
Heat maps are an ideal way to see how stocks are doing at a glance. I love using them to spot trends and find new trading ideas. The colors show if stocks are up or down, making it easy to see what’s hot and what’s not.
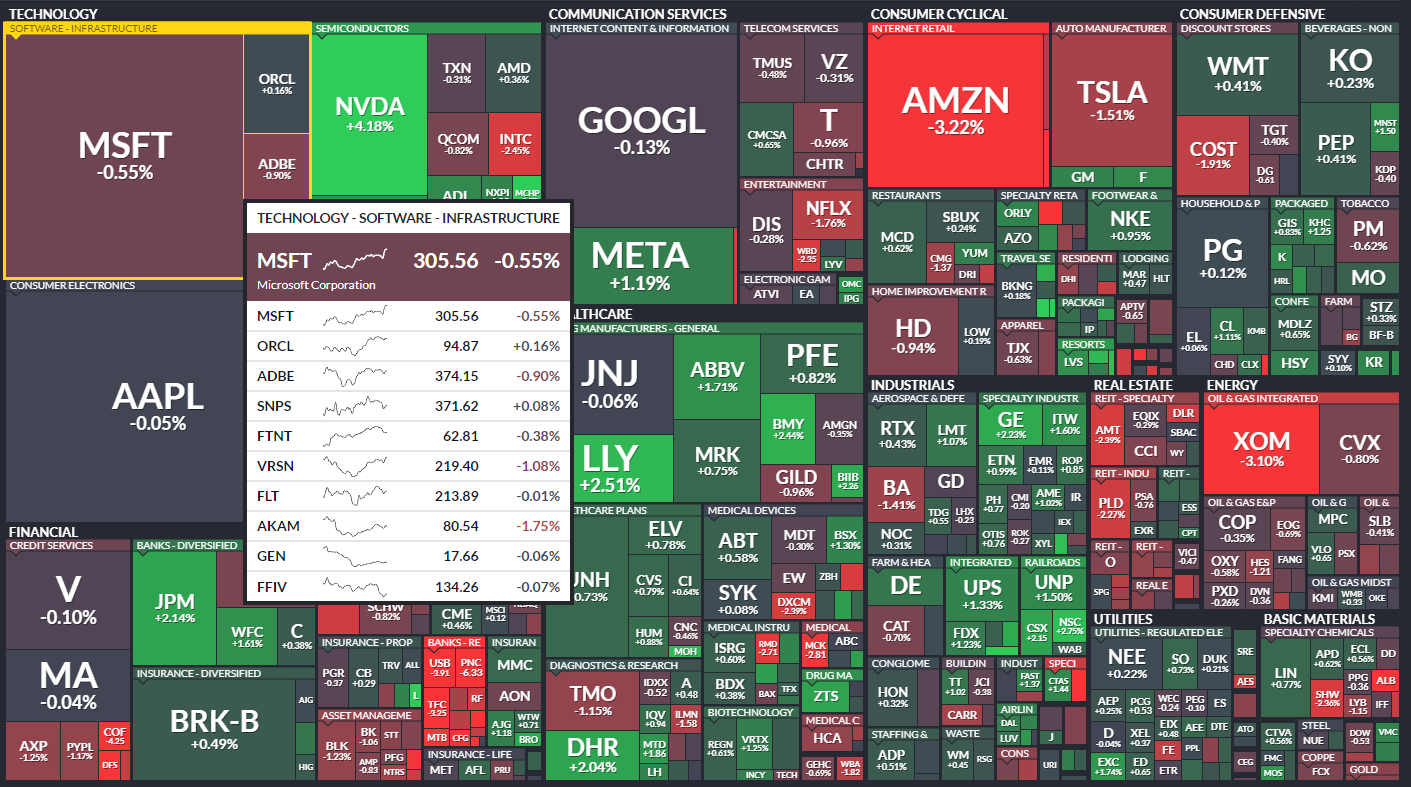
One heat map I really like lets me see the whole world’s stock markets on one page. It’s super fast, too! I can hover over any stock to see more info, like how it’s performing and who its competitors are.
These heat maps can show all sorts of things:
• How stocks are priced
• Trading volume
• Dividends
• Analyst ratings
I find it interesting that when I look at analyst recommendations, most stocks seem to get positive ratings. It makes me wonder if the experts might be a bit too optimistic sometimes.
The best part? I can click on any stock in the heat map to see more details right away. It’s a quick and easy way for me to explore the market.
Finding Great Stocks with Screeners
I love using stock screeners to find promising investments. These handy tools let me filter through thousands of stocks based on criteria I care about.
Some popular screeners cover 8,500+ major stocks and ETFs. While that’s a lot, it’s not every stock out there – the US alone has over 10,000! Still, it’s more than enough for most traders.
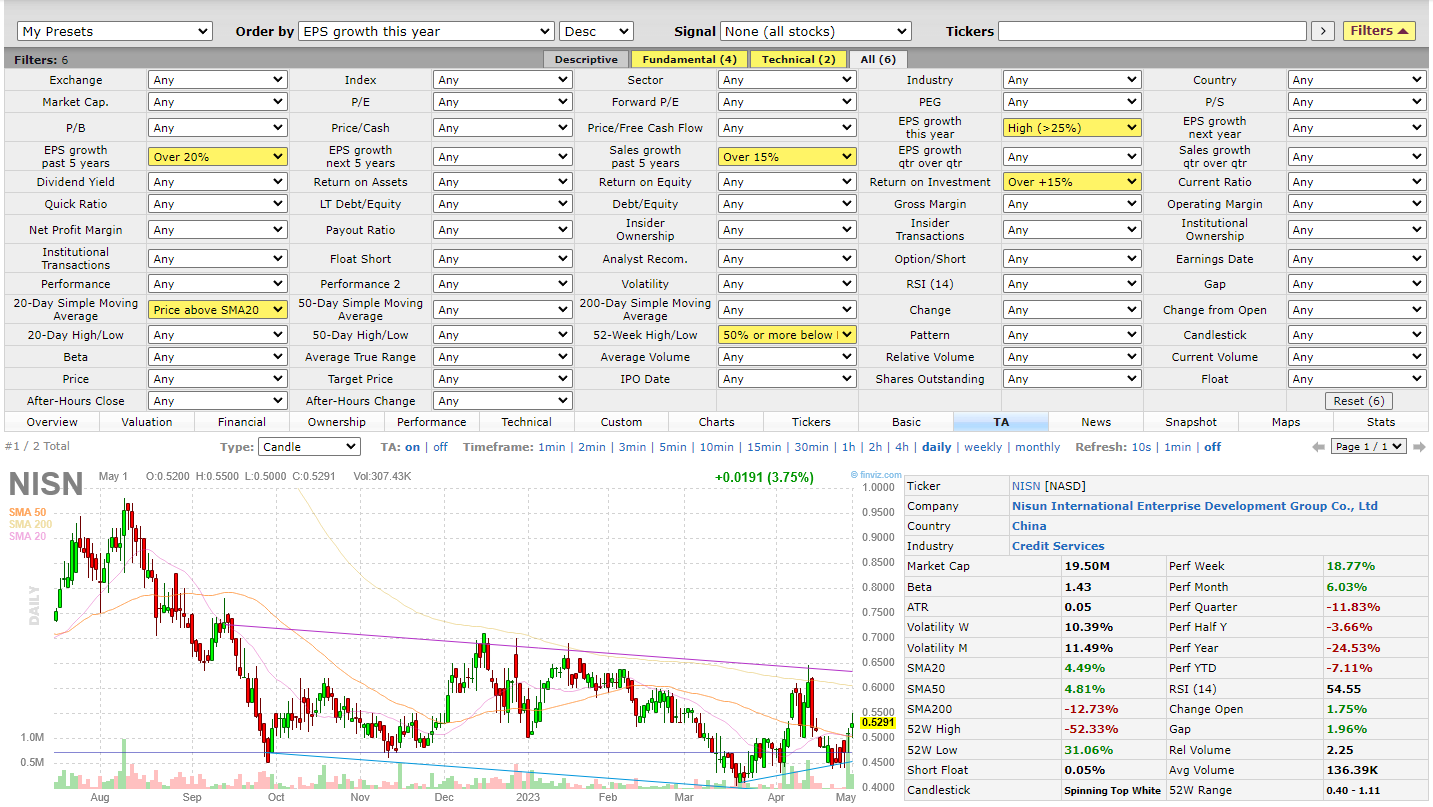
The best screeners let me filter stocks using tons of different factors. I can look at things like:
- Price
- Market cap
- P/E ratio
- EPS growth
- Revenue growth
- Debt levels
- Dividend yield
I can also screen for technical signals like:
- New 52-week highs/lows
- Stocks above/below moving averages
- Oversold/overbought conditions
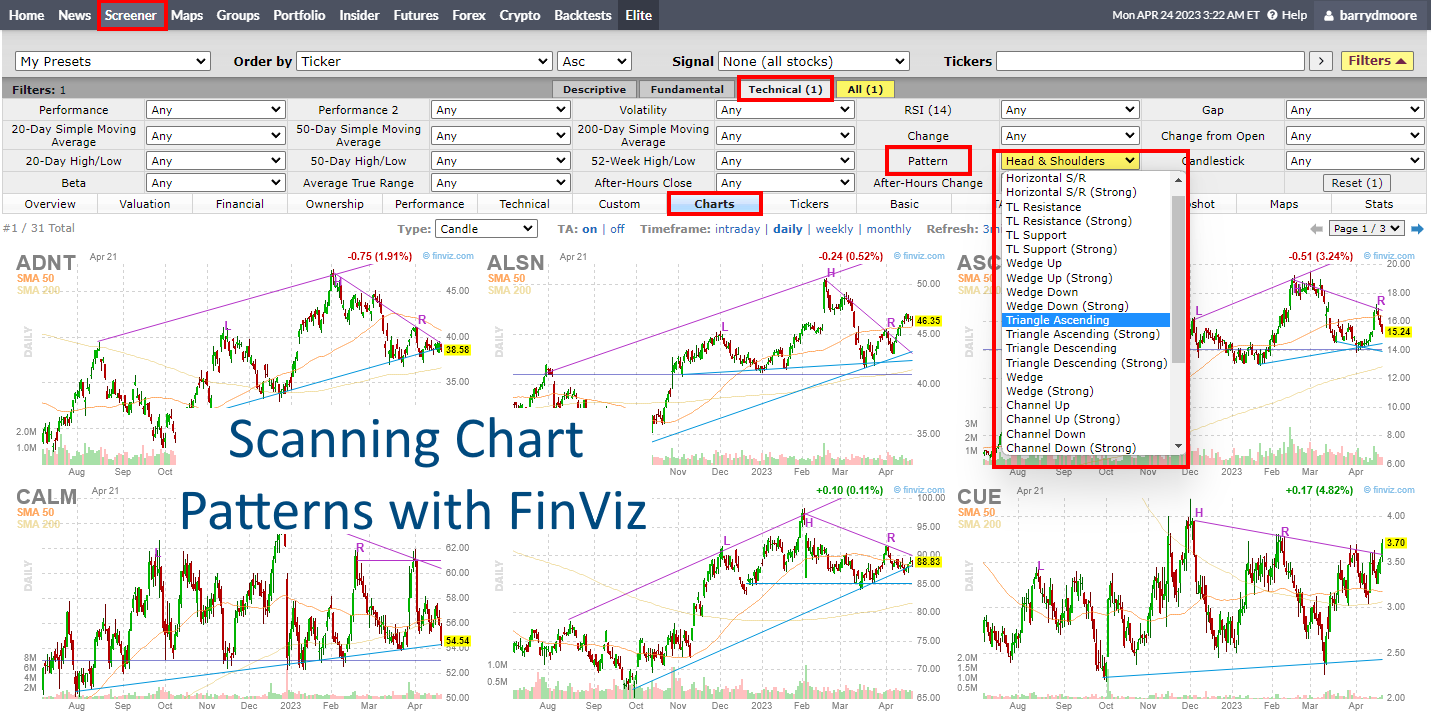
- Specific chart patterns
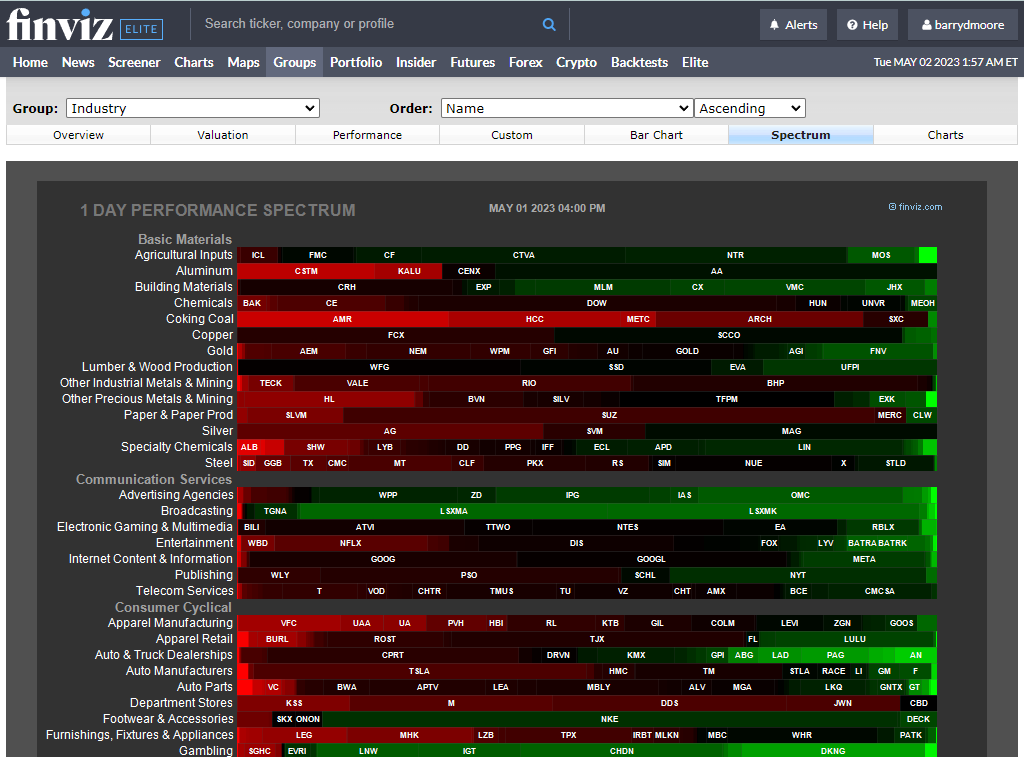
Stock Sector Performance
I find the Groups tab really helpful for seeing how different parts of the market are doing. It lets me check out stock sectors and industries over different time periods. I can spot which areas are hot and then zoom in on specific stocks that might be good to trade. It’s a neat way to get a quick snapshot of what’s moving in the market.
Portfolios
I like to monitor my investments. Finviz offers a simple way to track stocks I’m interested in. It’s not fancy, but it gets the job done. I can save stocks from my searches and put them into a list to watch. This makes it easy to see news about those companies all in one place. While it’s not a full portfolio tool, it’s handy for keeping tabs on potential trades.
News
Finviz is a great tool for keeping up with market news. It pulls headlines from big names like MarketWatch, Bloomberg, and CNBC. I find it handy for getting a quick overview of what’s happening. The best part? It lets me know if there’s news about stocks I own.
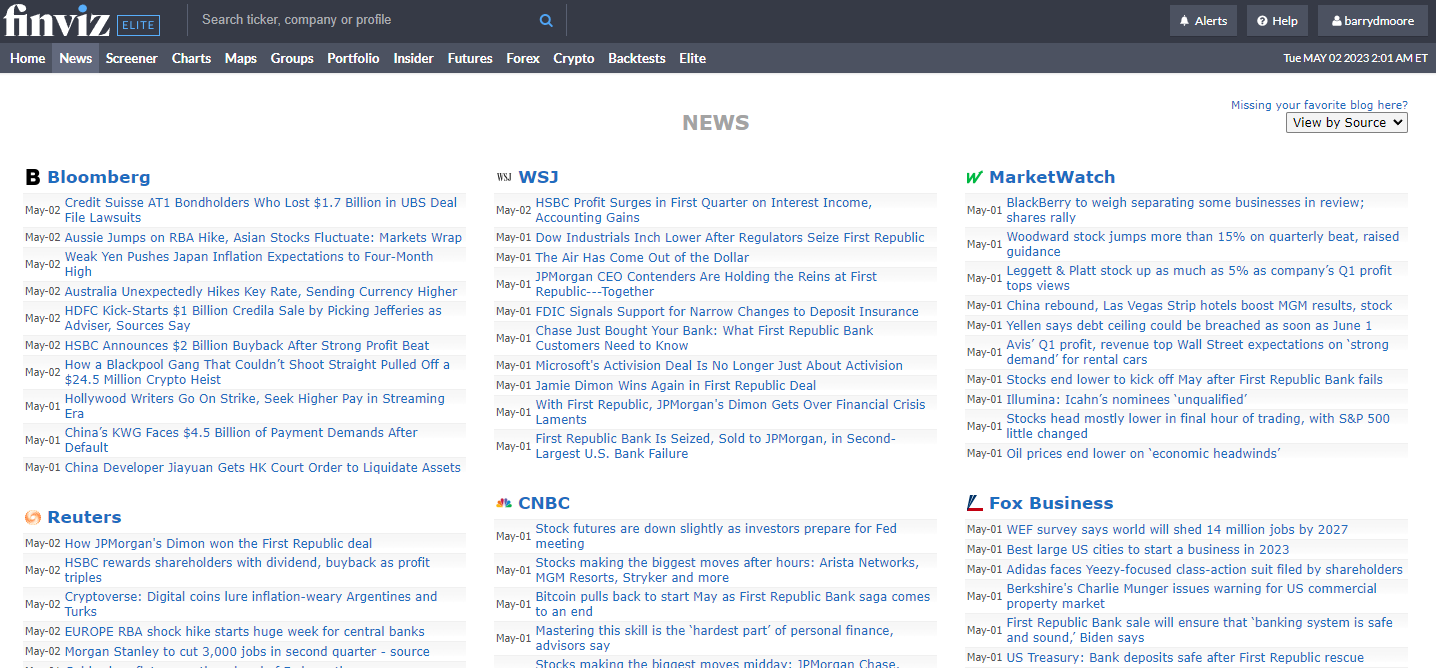
While Finviz is good for headlines, it can be tricky to read full articles from some sources. Many are behind paywalls. If I want more in-depth news, I might try Benzinga Pro.
One thing to note – Finviz doesn’t have social features like some other platforms. There’s no chat or community of traders to interact with. But for pure news, it does the job well.
I like to use a mix of sources to stay informed about financial news. This helps me make better investment choices.
Crypto and Forex on Finviz
I find Finviz’s crypto and forex heatmaps pretty basic. They only show 15 cryptos and 12 forex pairs. The charts are clickable, which is nice. I can see more details that way. But I can’t save any notes or settings on them. It’s a bummer there’s no performance data for cryptos. The forex section is bare-bones with no news or analysis. It’s an okay starting point, but I’d want more info for serious trading.
Finviz Elite Test
I paid for the Finviz Elite product, so I’ve had the chance to try out its features firsthand. Let me share my thoughts on one key aspect of the Elite plan.
Real-Time Data Test
I was excited to see how the real-time data worked in Finviz Elite. I thought I’d see flashing heatmaps and charts that changed every second. But it wasn’t quite what I expected.
The heatmaps and industry groupings don’t update automatically, and you can’t set them to refresh automatically. This was a bit of a letdown for me.
The stock charts were also different from what I imagined. They don’t show tick-by-tick data, and the smallest time frame is 1 minute. Plus, you can’t add your own indicators or save your chart settings, which made the charts less useful than I hoped.
Crafting a Winning Backtest on Finviz
I’ve spent a lot of time playing with Finviz’s backtesting tool, and I’m really impressed. It’s super easy to use, even if you don’t know how to code.
The backtesting tool has over 100 indicators! It can spot stock chart patterns independently, which means you can create some pretty unique trading systems.
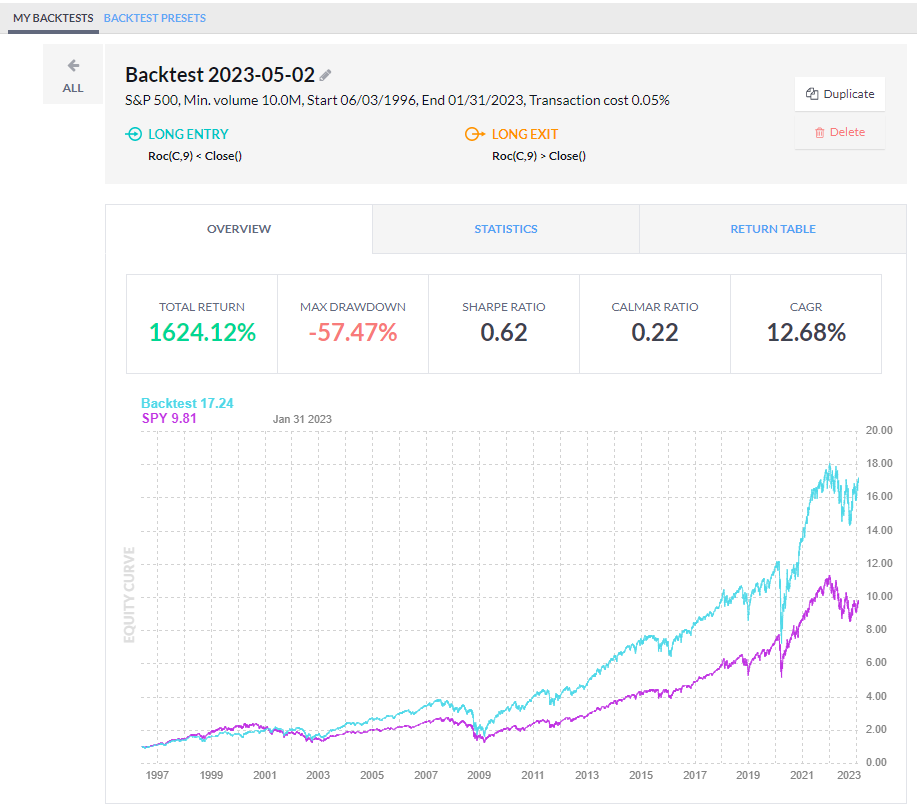
I created a strategy using the Price Rate of Change, and it did well. Over 25 years, it beat the S&P 500 by a good margin. My system made a 1,624% profit, growing at 12.68% per year, while the S&P 500 only grew at 10.44% yearly.
What I love most is how fast Finviz is. You can test your ideas on the whole market in no time. It’s flexible too, so you can tweak things easily.
I still think Finviz Elite has a lot to offer. One big plus is the backtesting tool, which lets you test trading ideas using 24 years of data. This feature alone makes the upgrade worth worthwhile.
If you’re curious about Finviz Elite, you can try it free for 30 days. This gives you a chance to see if it fits your needs before you commit.
Is Finviz Simple to Work With?
I find Finviz pretty straightforward to use, especially once I got the hang of it. It’s great for beginners looking to do basic stock research. The interface lets me focus on what matters without too many bells and whistles.
There are a few small hiccups, though. I can’t easily save my chart notes, and I can’t see interactive charts next to my watchlists.
Is Finviz a Good Deal?
I think Finviz is a great free tool for investors. It gives me useful features like heat maps and stock screening at no cost. I love the news updates and insider trading info too. For a free service, it packs quite a punch! I’d say it’s definitely worth checking out if you’re into stocks.
Is Finviz Elite a Good Investment?
I think Finviz Elite has some great features, but it’s not perfect. The real-time stock market visuals and pattern spotting are really helpful for finding trading opportunities quickly, which is a big plus in my book.
But there are some downsides, too. The backtesting doesn’t give enough information for solid system reports, and the charts only update every minute, not constantly. Plus, you can’t add your own indicators or save notes on the charts.
If you want top-notch backtesting and live charts, I’d suggest checking out TradingView instead. Depending on your needs, it might be a better fit.
★ Discover our list of free stock analysis software to unleash your inspiration! ★