Creating a high dividend yield stock screener can help investors pursue investments that generate reliable income. I’ll guide you through creating your stock screener and teach you how to analyze stocks effectively to uncover the best investment opportunities.
This guide will cover key criteria like dividend yield, growth rates, and payout ratios. I’ll share three proven strategies for identifying high-quality dividend stocks that align seamlessly with your investment goals.

Understanding High-Yield Dividend Stocks
A high-yield dividend stock offers a dividend yield significantly above the market average. The S&P 500’s average yield was about 1.5%. Stocks with yields of 4-5% or higher often fall into this category.
These stocks can be attractive to income-focused investors as they provide a steady stream of cash payments. However, there are risks to watch out for. A very high yield can sometimes signal problems with the company’s financials or business outlook.
When evaluating dividends, I always consider the payout ratio alongside the yield. This metric reveals what portion of a company’s earnings is distributed as dividends. Generally, a lower payout ratio indicates a more sustainable dividend.
Some sectors tend to have more high-yield stocks:
- Real Estate Investment Trusts (REITs)
- Utilities
- Telecommunications
- Energy
When evaluating high-yield dividend stocks, I consider the following:
- Company financials
- Dividend history and growth
- Industry trends
- Payout ratio
- Overall business strength
Tools like stock screeners can help find potential high-yield candidates. However, thorough research is key before investing in any high-yield stock.
Choose a Dividend Stock Screener
Picking the right dividend stock screener can make a big difference in finding great investment opportunities. Stock Rover stands out as a top choice for dividend investors like me. It offers a 14-day free trial of its Premium Plus Service, which I think is worth checking out.
Stock Rover’s screening tool allows me to examine 10 years of dividend history and financial data. This helps me spot stocks with consistent payouts and growth. I can also use the company’s “Fair Value” and “Margin of Safety” features to find stocks that might be undervalued.
For investors looking beyond the US and Canada, I recommend TradingView or MetaStock. These platforms cover stocks from many countries:
- TradingView: Good for value and dividend screening globally
- MetaStock + Refinitiv Xenith: Offers fundamental screening and real-time news
Here’s a quick comparison of key features:
| Feature | Stock Rover | TradingView | MetaStock |
|---|---|---|---|
| Market Coverage | US & Canada | Global | Global |
| Dividend History | 10 years | Varies | Varies |
| Fair Value Tool | Yes | No | No |
| Real-time News | No | Limited | Yes |
When using these screeners, I focus on important factors like:
- Dividend yield
- Payout ratio
- Market cap
- Dividend growth rate
Stock Rover – The Smart Choice for Savvy Long-term Investors
As an investor, I’ve always wanted powerful insights without the complexity. Stock Rover changed the game for me. With its deep screening tools and hundreds of metrics, I can quickly find stocks and ETFs that match my strategy. It streamlined my research and made decision-making so much easier.
Comparing investments used to be a hassle—now it’s a breeze. Stock Rover lets me analyze multiple stocks, ETFs, or portfolios side by side. I get clear views on fair value, quality, and growth potential, helping me make smarter, more confident choices.
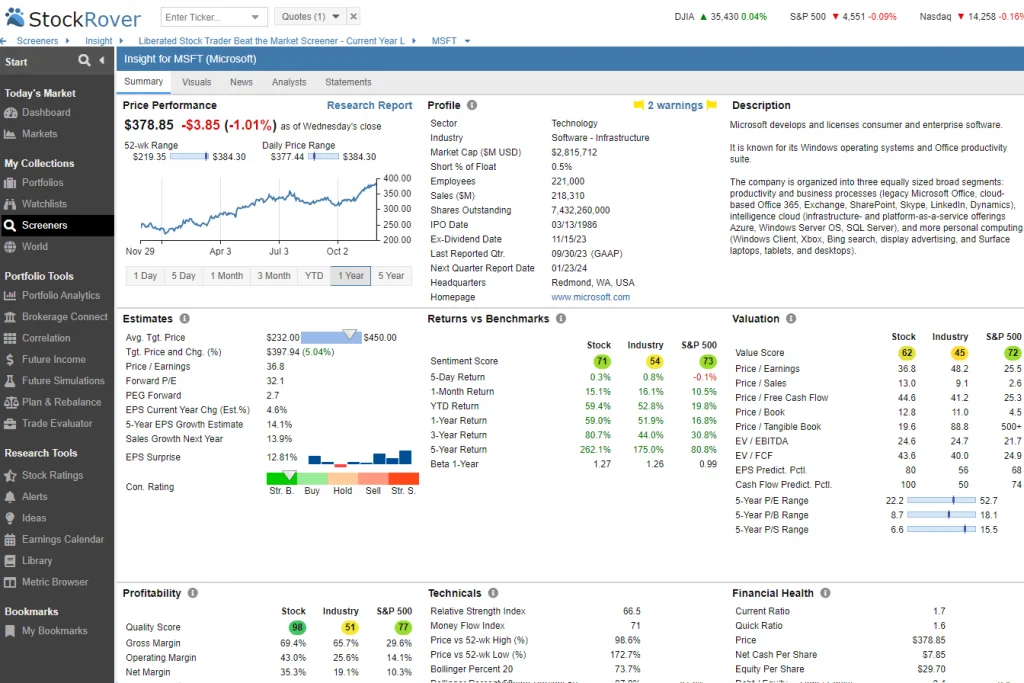
Tracking my portfolio is now seamless. By linking my brokerage, I get real-time updates and detailed analytics. Features like dividend forecasts and rebalancing tools help me stay on track and plan effectively for the long term.
Stock Rover is the only service I recommended for growth, dividend, and value investors.
Strategy 1: Maximum Dividend Yield
Highest Dividend Yield Criteria
To find the best high-yield dividend stocks, I use these key criteria:
- Market cap over $500 million
- Dividend yield above 4%
- Positive 1-year and 3-year dividend growth
- Payout ratio under 90%
- Stocks from all exchanges (including OTC)
These filters help me identify promising high-yield options while managing risk.
Highest Dividend Yield Explained
I start by looking for stocks with market caps above $500 million, which helps me avoid small, risky companies. Then, I focus on yields over 4% to get a good income stream.
I want to see dividend growth, so I check for increases over the past 1 and 3 years. This shows the company can sustain and grow its payout.
A payout ratio under 90% is important. This means that the company is not overextending its ability to pay dividends.
I include OTC stocks in my search. While they can offer high yields, they also carry extra risks. OTC stocks often have less liquidity and oversight.
When I run this screen, I get a mix of results. Many are OTC stocks, which need extra caution. Let’s look at an example:
The top yield in my latest screen was 30% from CTPZY, an OTC stock. That sounds great, but I always dig deeper. Looking closer, I saw:
- The dividend has been falling
- Earnings are down
- The payout ratio is 54.2%
This tells me that the high yield might not last. The company is paying out over half its earnings as dividends, which is high and might not be sustainable.
Key Points
I’ve learned some key lessons from using this strategy:
- High yields can be a warning sign
- Always check dividend growth trends
- Look at earnings and payout ratios
- Be extra careful with OTC stocks
- A sustainable 4-5% yield is often better than an unsustainable 10%+ yield
This strategy can yield some gems, but it requires careful research. I never invest based on yield alone. I always consider the company’s finances, market position, and future prospects.
Strategy 2: High Dividend Yield & Growth
Criteria for High Dividend Yield and Growth
I’ve found that focusing on specific criteria can help identify promising dividend stocks with growth potential. Here are the key metrics I look for:
- Market Cap > $500 million
- Dividend Yield > 3%
- 1-Year Dividend Change > 2%
- 3-Year Average Dividend Change > 2%
- 5-Year Average EPS > 0
- Payout Ratio < 50%
These criteria help me find established companies with attractive yields, consistent dividend growth, and sustainable payout levels.
This strategy balances income and growth while managing risk. A yield above 3% provides solid income, while the dividend growth requirements show a commitment to increasing payouts. The positive EPS trend points to earnings stability.
I pay close attention to the payout ratio. Keeping it below 50% gives companies room to grow dividends and reinvest in the business, improving the chances of sustainable long-term dividend growth.
Market cap is also important. I stick to companies with market caps over $500 million, as they tend to be more stable. Smaller companies can be riskier investments.
The 1-year and 3-year dividend growth metrics help me spot consistent increases. I want to see steady raises, not just a one-time bump.
Key Points
When I recently applied these criteria, I found 127 stocks that met the criteria. Let’s examine two examples to see how this works in practice.
Enel Americas (ENIA) tops the list with a 7.2% yield and 35.4% payout ratio. At first glance, this looks great. But digging deeper, I noticed some red flags:
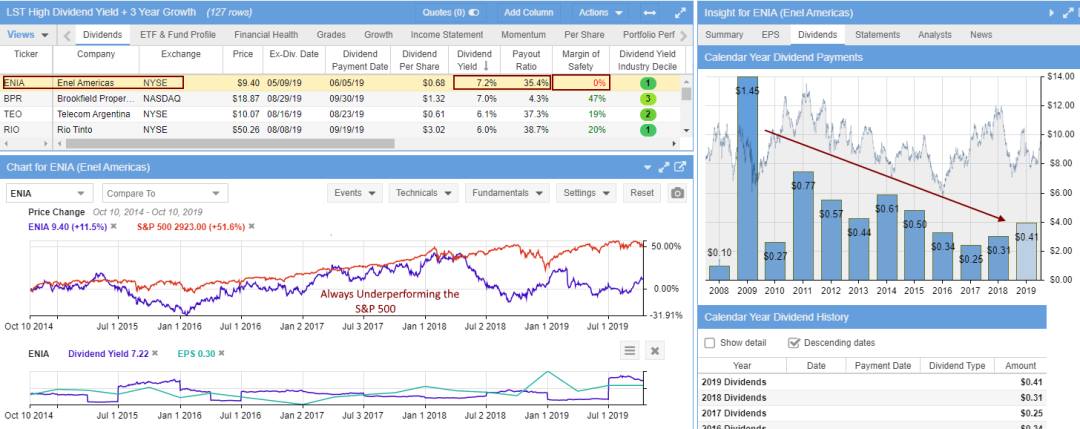
The dividend payments are declining over time, and there’s no margin of safety based on discounted cash flow valuation. This makes me cautious about ENIA’s ability to maintain its high yield.
Next, I looked at Brookfield Property (BPR), a real estate investment trust:

BPR’s 7% yield caught my eye. What I really like is its 10-year record of increasing dividends, which shows a strong commitment to rewarding shareholders. The 47% margin of safety is also reassuring.
But it’s not all rosy. BPR’s stock price has dropped 30% over two years. This explains the high yield, as yield rises when the price falls. The dividends grew 14% at that time, which helped offset some losses.
I see BPR as the stronger choice between these two. The consistent dividend growth and safety margin are big pluses. Yes, the price drop is concerning. However, the growing dividend stream is attractive for long-term investors focused on income.
Strategy 3: High Dividend Yield & Value
High Dividend Yield and Value Criteria
To find stocks that fit this strategy, I use the following criteria:
- Dividend Yield > 2
- Dividend 5-Year Average > 1%
- EPS 5 Year Avg > 8%
- Payout Ratio < 60
- Sales 5 Year Avg > 3%
- Price / Sales < 2
- Margin of Safety > 1
These benchmarks help me identify stocks that offer good value and steady income.
I look for cheap stocks that pay dividends using common measures like low price-to-earnings, price-to-sales, and price-to-book ratios. These companies should also be growing their sales and earnings.
A key part of this approach is the margin of safety, which I want to be greater than 1. This means the stock price can drop quite a bit before I lose money. The margin of safety is based on the company’s expected future cash flow and earnings.
For this strategy, I use Stock Rover as my screener. It provides me with special tools based on Warren Buffett’s ideas about fair value and the margin of safety.
A Practical Example of Fundamental Analysis
Let’s look at Carnival (CUK) as an example. It came up in my screen results with a high dividend yield.
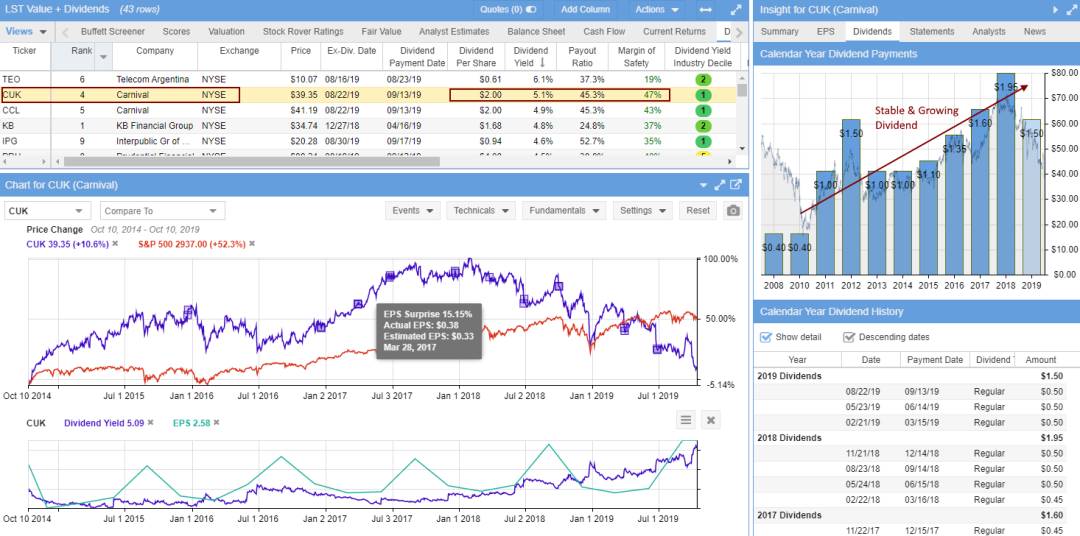
I see that earnings have grown even though the stock price has had a bad year. The dividend yield is 5.1%, which is good. The payout ratio is 45%, which is okay.
Its margin of safety is 47%, which means there’s not much risk at the current price of $39 per share.
If I think this stock looks promising, I dig into the financials more. Here are Stock Rover’s ratings for Carnival:
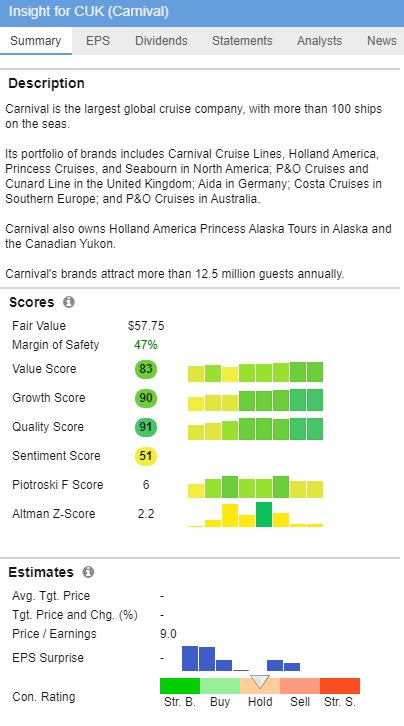
Value Score: 83. This score considers factors such as EV / EBITDA, P/E, and Price / Sales and compares the company to others in its sector and across all stocks.
Growth Score: 90. This checks the 5-year history and future estimates for EBITDA, Sales, and EPS growth.
Quality Score: 91. This score considers profit and balance sheet metrics such as ROIC, Net Margin, and Debt / Equity ratio.
These scores suggest this stock might be worth investing in.
This strategy works well for investors who want a steady income without too much risk. It involves finding cheap stocks that can continue paying dividends even when times are tough.
Building Your High Dividend Yield Screener
Setting up high dividend yield screeners on Stock Rover is simple. After signing up, you can get started with just five quick clicks.
First, click on “Library” to access pre-built tools. Then select “Screener” to see over 150 options.
In the search box, type “Dividend” to narrow down the choices. Next, pick the 6 Dividend Strategy Screeners shown in the image. Finally, click “Import Selected Items” to add them to your account.
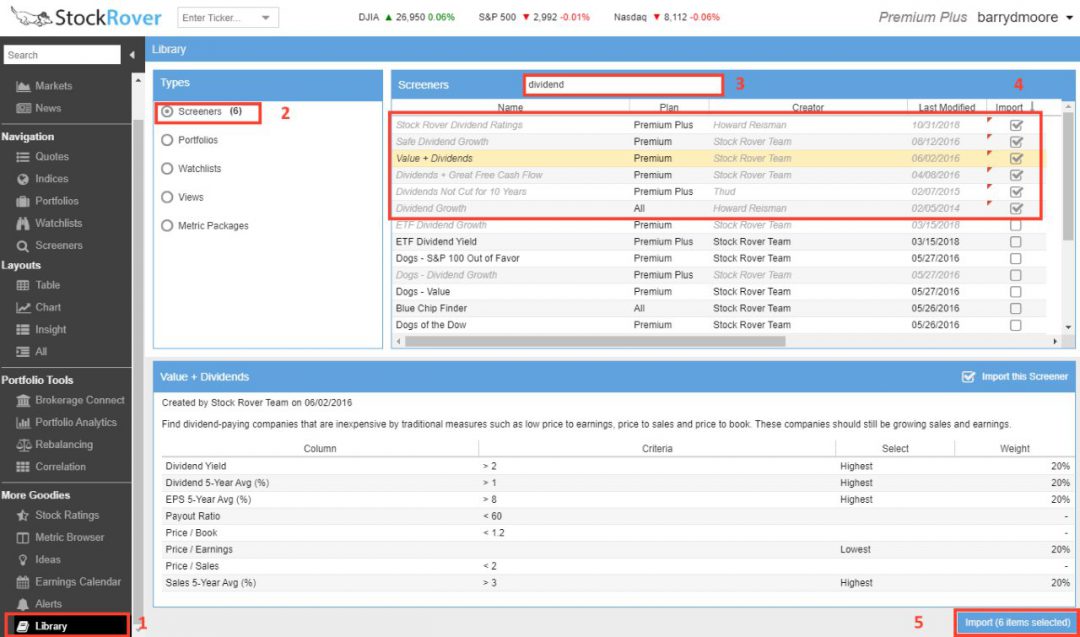
These six key strategies are now ready to use in your screener list. They come pre-filled with potential investments, saving you time and effort. This method lets you quickly start looking for high-yield dividend stocks without building screeners from scratch. It’s a simple way to begin your search for dividend-paying companies that match your investment goals.
Researching High-Dividend Yield Stocks
I’ve found that investigating a company’s financials is key when evaluating high-dividend stocks. I like to check debt levels, interest payment coverage, and return on equity.
The quick ratio can also give me a good idea of their short-term financial health.
For my research, I use tools like Stock Rover. This tool lets me compare a company to others in its sector over time, helping me spot trends and get a fuller picture of the stock’s performance.
Some high-yield options I’ve looked at include:
- FS KKR Capital Corp
- Icahn Enterprises
- TORM PLC
- AGNC Investment Corp
- Blue Owl Capital Corporation
I also monitor REITs for steady income. Dividend Aristocrats are another group I consider because they have a history of raising payouts.
Using Stock Ratings for Analysis
When I dive into a company’s financial health, I turn to the Financial Strength Report. It’s a goldmine of information. Let’s take Microsoft (MSFT) as an example.
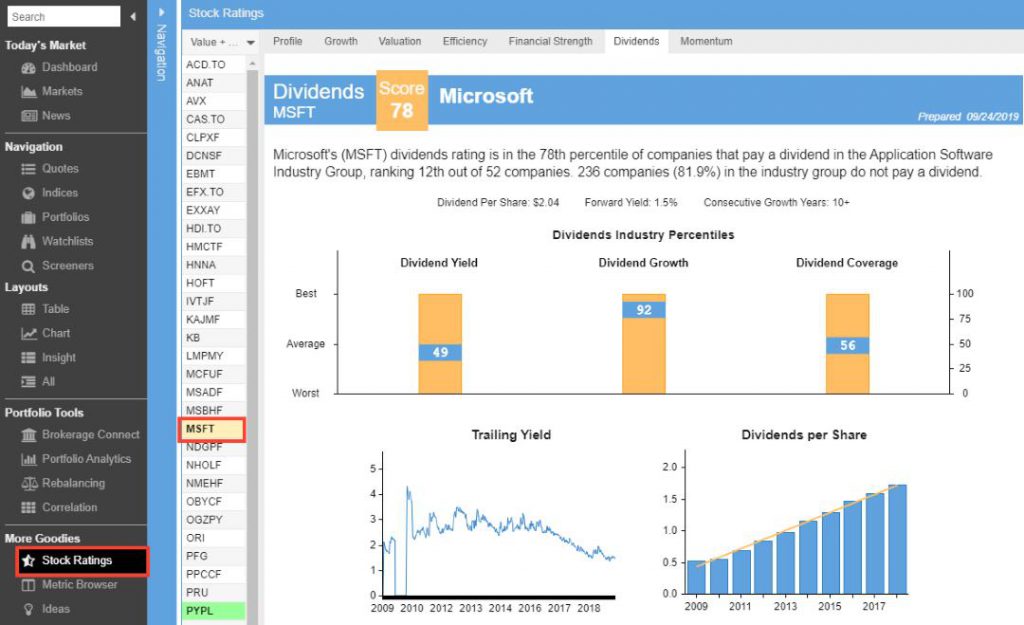
MSFT’s Financial Strength Score stands at 73 out of 100. Not bad at all.
The report shows me two key metrics:
- Debt to Equity: MSFT is below the industry average
- Interest Coverage Ratio: MSFT is above the industry average
I find the 10-year trends for these metrics particularly useful. They give me a clear picture of the company’s financial trajectory.
But here’s where it gets really interesting. The Peers Financial Strength Scores chart is a game-changer. It lets me compare MSFT’s financial strength against that of its competitors, often leading me to discover new investment opportunities I might have overlooked.
Dividend Analysis and Stock Ratings Report
Now, let’s switch gears and look at Apple (AAPL) through the lens of the Dividend Analysis Report.

The Dividend Industry Percentiles chart tells me two key things:
- AAPL’s dividend yield is slightly below average (45th percentile)
- Its dividend growth is top-notch (92nd percentile)
This combination catches my eye. It suggests AAPL might be a good pick for long-term dividend growth.
The Trailing Yield chart shows that AAPL has kept its dividend yield between 1.5% and 2.5% since restarting dividends in 2012. Plus, the Dividend per Share has been on a strong upward trend.
Here’s a quick comparison of AAPL against a peer:
| Metric | Apple (AAPL) | Hewlett Packard (HPQ) |
|---|---|---|
| Dividend Yield | Lower | Much Higher |
| Dividend Growth | Industry-leading | Lower |
This table highlights an important point: a high yield isn’t everything. AAPL’s strong dividend growth could make it a better long-term choice despite its lower current yield.
The payout ratio is another crucial metric I always check. It tells me how much of a company’s earnings are being paid out as dividends. A low payout ratio suggests room for future dividend growth, while a high ratio might be unsustainable.
For dividend stocks, I pay special attention to the dividend payout ratio. This ratio shows me the percentage of net income distributed to shareholders. A ratio between 30% and 50% often indicates a healthy balance between rewarding shareholders and reinvesting in the business.
Portfolio Analytics
I find Stock Rover’s Portfolio Analyzer to be a game-changer for managing high dividend yield investments. By connecting it to my broker, I get real-time updates on key metrics like Total Return, Beta Risk, and Volatility Score. This helps me keep a close eye on my portfolio’s performance and adjust my strategy as needed.
Another feature I use often is the Stock Comparison Tool. It lets me compare multiple stocks side by side, which is crucial when I decide which ones to add or remove from my dividend portfolio. This tool has been invaluable in helping me make smarter investment choices.
Here’s a quick look at some key metrics I track:
- Total Return
- Beta Risk
- Volatility Score
- Dividend Yield
- Payout Ratio
By linking Stock Rover to my brokerage account, I unlock advanced portfolio reporting that my broker doesn’t offer. While I still make trades through my broker, Stock Rover handles all the performance and risk reporting.
To set this up, select Brokerage Connect from the left menu and follow the prompts. This straightforward process has greatly improved my ability to manage and analyze my high dividend-yield portfolio.
Dividend Income Reporting
Connecting Stock Rover to my broker or manually adding stocks gives me great portfolio reporting tools. Let’s examine how this works.
Portfolio Analytics
I’ve picked the Warren Buffett Top 25 Holdings portfolio as an example. This ready-made portfolio shows the top 25 companies Buffett owns.
The Value Over Time tab reveals some key facts:
- 7.3% annual return over 10 years
- 88.1% stock value increase
- 116% total return on investment
- $26 million in dividend income
These numbers clearly show the portfolio’s performance. I can see at a glance how much my investments have grown and how much passive income they’ve generated.
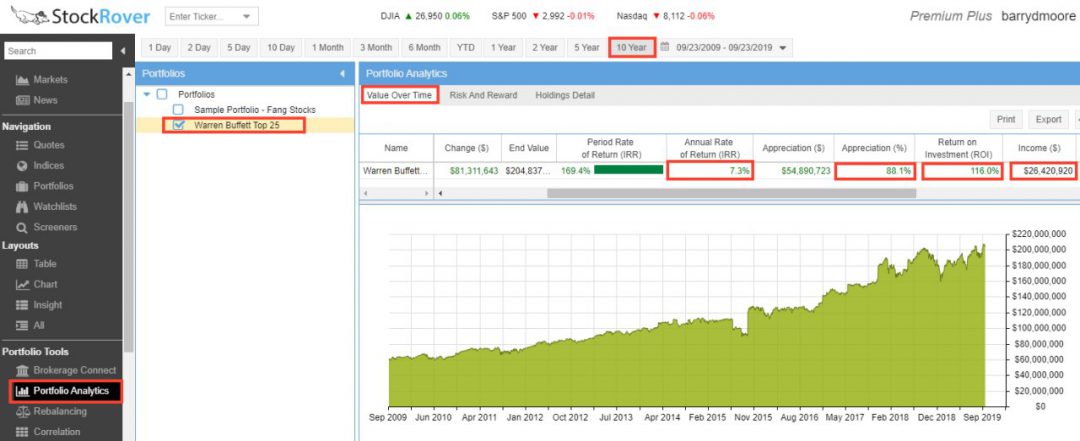
This image shows the portfolio analysis screen. I can quickly spot trends and compare different metrics. It’s a powerful tool for tracking my dividend stocks and making smart choices.
Summary
I’ve found that building a powerful high dividend yield stock screener is simpler than you might think. It starts with picking the right software and deciding on your dividend strategy. Then, I create screening criteria to find great companies. After that, I do a deep dive into the most promising stocks. This process helps me choose the best picks for my portfolio. Remember, careful analysis is key to success in dividend investing.
FAQ
What sectors have high-yield dividend stocks?
In my experience, certain sectors tend to be hotspots for high-yield dividend stocks. Utilities, Real Estate, Energy, and Telecommunications often top the list. These industries typically have stable, predictable income streams that support generous dividend payouts.
Why do some companies not pay dividends?
Some companies choose to plow their profits back into the business instead of paying dividends. Amazon is a prime example. They prioritize growth and reinvestment over shareholder payouts. This strategy can lead to higher stock prices over time, which is another way to reward shareholders.
Are dividends taxable?
Yes, dividends count as income and are usually taxed. The exact rate depends on factors like my tax bracket and where I live. There’s also a difference between qualified and non-qualified dividends, which can affect the tax treatment.
