I’ve created many dividend stock screening strategies to help investors find reliable income-producing companies. A screener lets you filter stocks based on key metrics like yield, payout ratio, and dividend growth rate.
My tested screening strategies are designed for different investing styles. Whether you’re looking for high yields, safe payouts, or growing dividends, you can customize the criteria to match your goals. I’ll show you how to set up the right parameters to uncover dividend stocks that fit your strategy.
A dividend stock screener is a tool I use to find stocks that pay regular dividends. It helps me filter through tons of options in the market. I can set criteria like dividend yield, payout ratio, and growth history. The best screeners let me look at 10 years of financial data. This helps me spot stocks with steady dividends and strong financials.
1. Choose Your Dividend Stock Screener Carefully
For US and Canadian investors, I recommend Stock Rover as the top dividend screener. It’s my top pick when comparing the best stock screeners and value investing tools. For further information, please visit my Stock Rover Review.
Stock Rover offers a free 14-day trial of their Premium Plus Service, which gives you access to 10-year dividend histories, fair value estimates, and margin of safety criteria.
Here are some key features of Stock Rover:
- Flexible screening options
- Comprehensive dividend data
- Value investing metrics
Stock Rover – The Smart Choice for Savvy Long-term Investors
As an investor, I’ve always wanted powerful insights without the complexity. Stock Rover changed the game for me. With its deep screening tools and hundreds of metrics, I can quickly find stocks and ETFs that match my strategy. It streamlined my research and made decision-making so much easier.
Comparing investments used to be a hassle—now it’s a breeze. Stock Rover lets me analyze multiple stocks, ETFs, or portfolios side by side. I get clear views on fair value, quality, and growth potential, helping me make smarter, more confident choices.
Tracking my portfolio is now seamless. By linking my brokerage, I get real-time updates and detailed analytics. Features like dividend forecasts and rebalancing tools help me stay on track and plan effectively for the long term.
Stock Rover is the only service I recommended for growth, dividend, and value investors.
Top Dividend Screeners for Global Investors
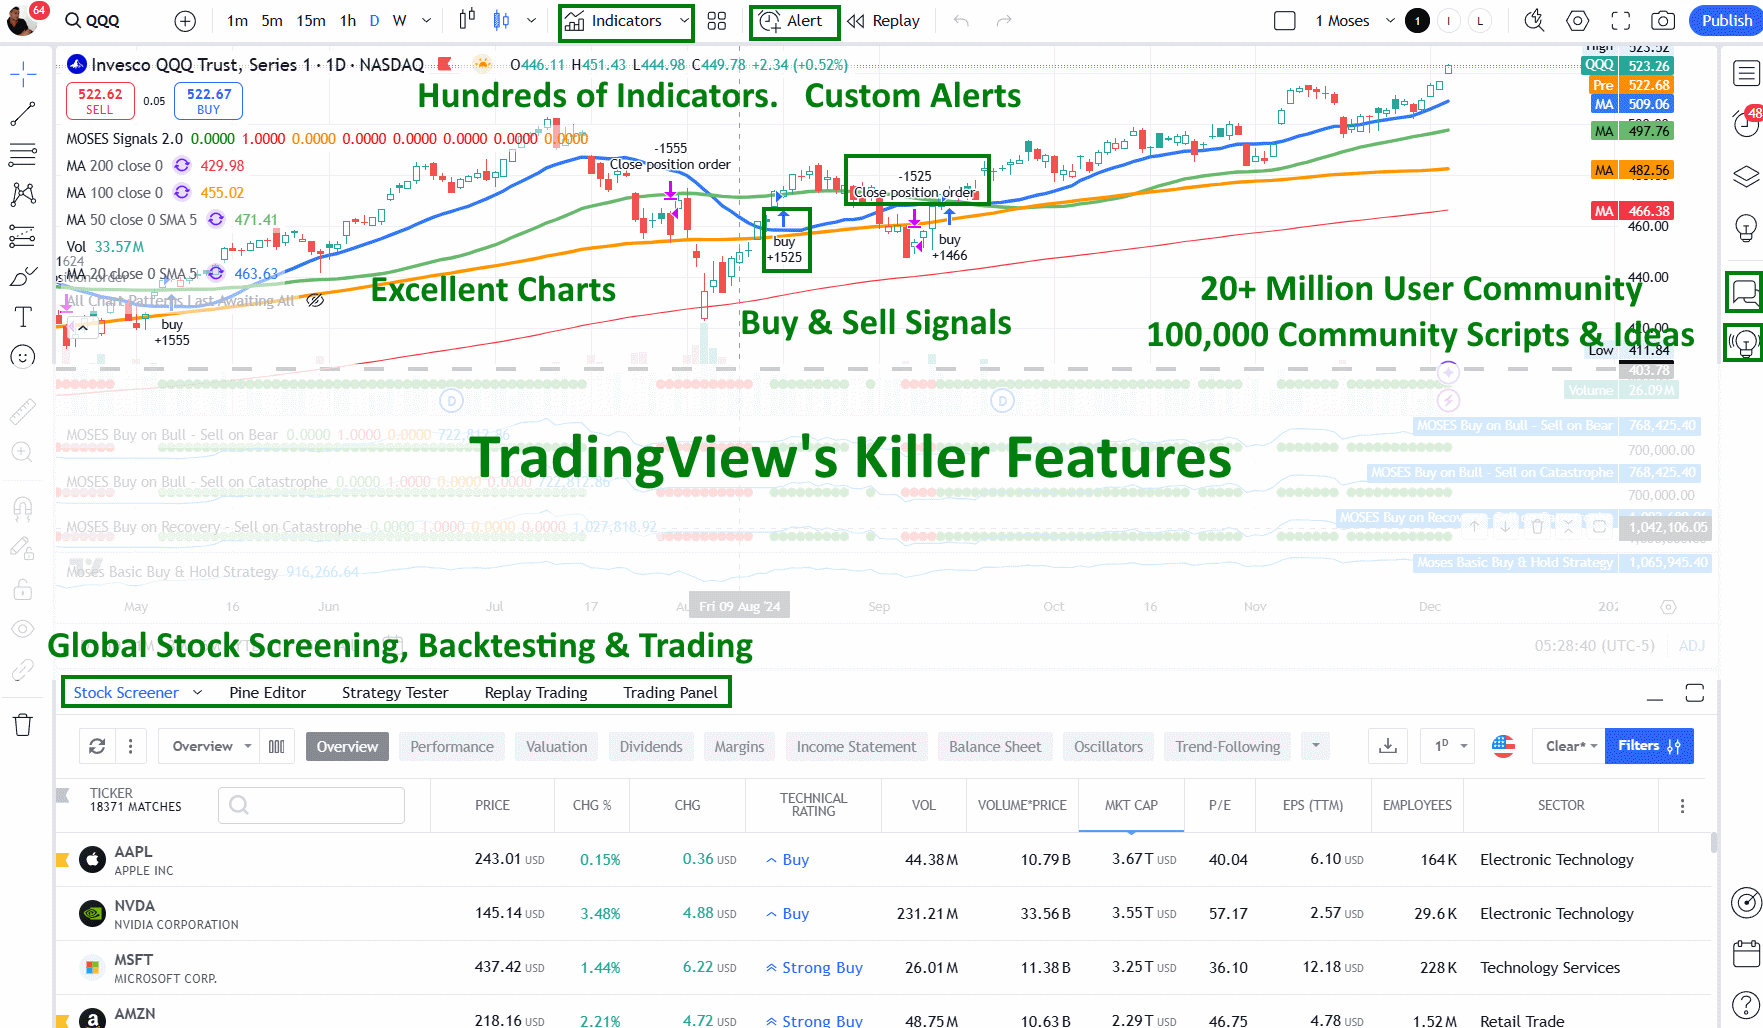
For those looking beyond US and Canadian stocks, I suggest TradingView
TradingView offers real-time charts and financial screening for international stocks, forex, and cryptocurrencies.
With TradingView, users can easily create customizable charts that display price movements, volume data, and indicators such as moving averages and Bollinger bands. These charts can also be shared with others, allowing for collaboration and idea-sharing among traders.
But TradingView is more than just a charting platform. It also has a social aspect where users can follow other traders, view their trading ideas and strategies, and even interact with them through comments and direct messages. This creates a community of traders who can learn from each other.
TradingView gets my top rating! It’s hands down the best trading software out there, offering built-in broker integration, powerful backtesting tools, advanced scanners, and access to the world’s largest trading community. It’s a game-changer for traders at all levels!
For more detailed insight, please visit my TradingView review.
2. Select Your Ideal Screening Strategy
1. High-Yield Dividend Approach
Seeking companies with high dividend yields can be an attractive approach for income-focused investors. A yield of 10% might seem tempting, but it’s important to dig deeper. Such high yields often result from falling stock prices, which could signal trouble.
To balance risk and reward, I look for:
- Market cap > $500 million
- Dividend yield between 3% and 10%
- 1-year and 3-year average dividend growth > 2%
- Payout ratio between 30% and 60%
This strategy aims to find stocks with substantial yields that are also sustainable. The payout ratio limit helps ensure the company isn’t stretching itself too thin to maintain dividends.
2. Secure Dividend Strategy
For a more conservative approach, I focus on larger, more stable companies with a track record of consistent dividend payments.
My criteria include:
- Market cap > $2 billion
- Dividend yield > 1.5%
- Positive dividend growth over 1, 3, and 5 years
- Listing on major exchanges (NYSE, NASDAQ, etc.)
- Payout ratio between 30% and 50%
- 5-year average sales growth > 4.5%
These stricter requirements help build investor confidence by targeting companies with a proven ability to maintain and grow dividends over time.
3. Dividend Strategy with Undervalued Stocks
I combine dividend investing with value investing principles in this strategy. The goal is to find undervalued companies that also pay dividends, providing potential for both income and capital appreciation. My criteria include:
- Dividend yield > 2%
- 5-year average dividend growth > 1%
- 5-year average EPS growth > 8%
- Price-to-book ratio < 1.2
- 5-year average sales growth > 3%
- Payout ratio < 60%
- PE ratio in the lowest 20% of the stock’s sector
I pay special attention to the PE ratio, comparing it to industry peers rather than using a fixed number. This accounts for varying valuation norms across different sectors.
3. Create Your Custom Dividend Stock Screener
Let me guide you through the simple process of setting up professional dividend stock screeners in Stock Rover. In just five steps, you’ll have everything ready to go.
- Click on “Library” to open a wide range of pre-built tools.
- Click “Screener” to see over 150 ready-made screeners.
- Type “Dividend” in the search box.
- Pick the 6 Dividend Strategy Screeners shown in the image.
- Click “Import Selected Items” to add them to your account.

After these steps, you’ll have six key dividend strategies in your screener list. These are filled with stocks that fit each strategy. It’s a quick way to start looking for dividend-paying stocks that match your goals.
This method saves time and helps me spot good dividend stocks quickly. You can tweak these screeners later to fit your exact needs. For now, they give you a solid starting point to explore dividend investing.
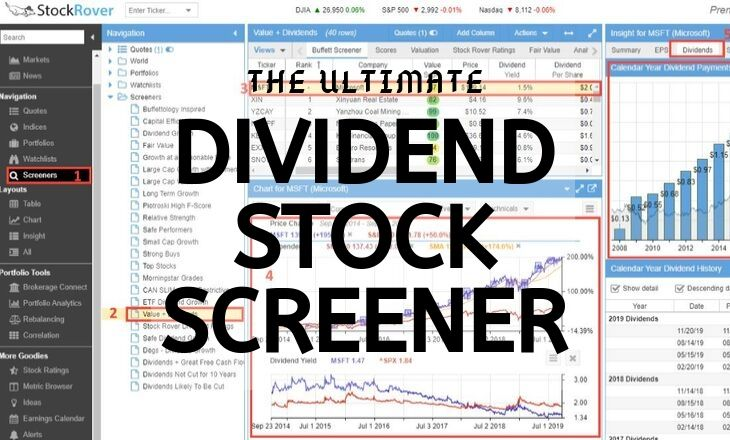
4. Discover and Choose Your Dividend Stocks
A simple process to investigate dividend stocks after setting up screeners:
- Click on “Screeners” in the left menu
- Pick the “Value + Dividends” screener
- Choose the “Dividends” view and select a company (e.g. Microsoft – MSFT)
- Compare the stock to an index like the S&P 500 in the chart window
- Check the “Dividends” tab for 10-year dividend history and growth
Here’s a helpful tip: Plot the dividend yield over time in the chart for a clear visual of its trend.

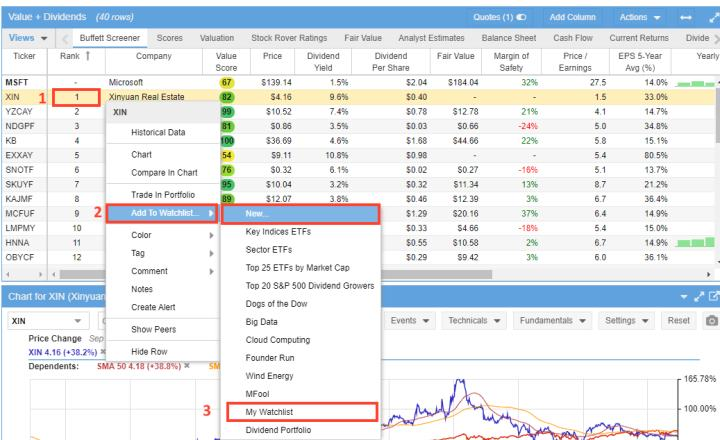
How to Add Your Favorite Stocks to Your Watchlist
After finding promising stocks, I like to add them to a watchlist for closer tracking.
It’s easy:
- Right-click the stock ticker
- Pick “Add to Watchlist”
- Click “New” to make a fresh list, or use “My Watchlist.”
You can tweak any imported screeners to fit your needs. This lets me keep an eye on the stocks I’m most interested in.
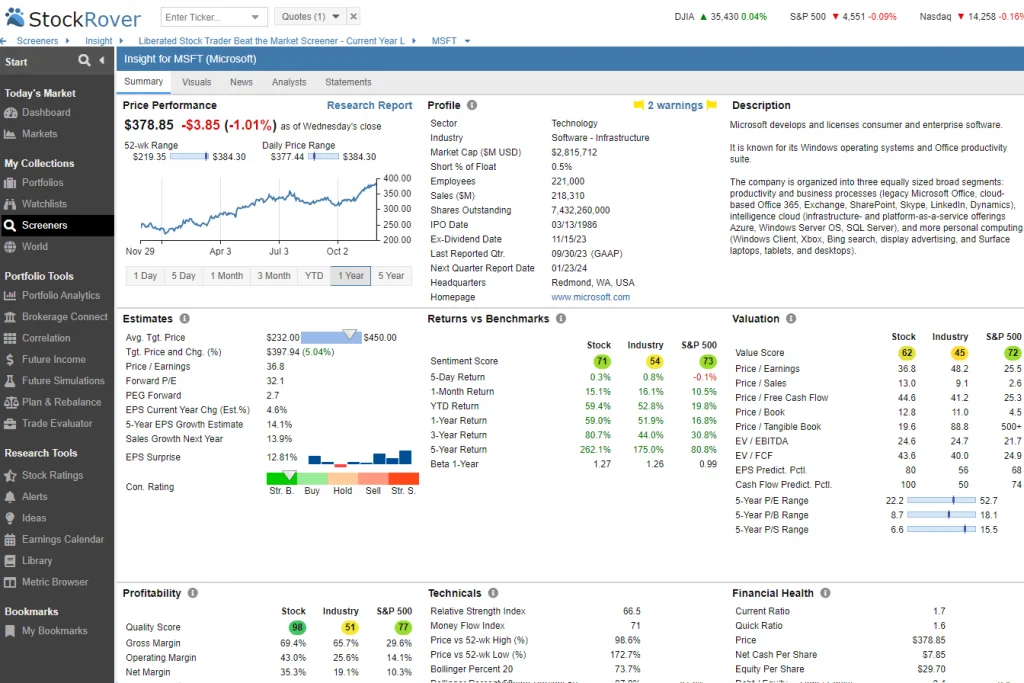
5. Conduct Comprehensive Company Research and Analysis
Stock Rover’s Stock Ratings system is a game-changer for in-depth company analysis. It lets me compare a company against its sector and industry over time. The system covers key areas like growth, valuation, efficiency, financial strength, dividend analysis, and stock price momentum. This comprehensive approach helps me assess a company’s performance and potential.
Financial Strength Reports
The Financial Strength tab in Stock Rover is my go-to resource for assessing a company’s financial health.
Let’s take Microsoft (MSFT) as an example:
- Financial Strength Score: 73 out of 100
- Debt to Equity: Below industry average
- Interest Coverage Ratio: Above industry average

The 10-year trends for Total Debt to Equity and Interest Coverage Ratio are really useful for spotting long-term patterns. The Peers Financial Strength Scores chart is a goldmine for comparing a company to its competitors at a glance.
Dividend Analysis Reports
For dividend analysis, I like to look at companies in detail.
Let’s use Apple (AAPL) as an example:

The Dividend Industry Percentiles chart shows:
- Dividend yield: Slightly below average (45th percentile)
- Dividend growth: Among the best (92nd percentile)
I’ve noticed Apple’s trailing yield has stayed between 1.5% and 2.5% of the stock price. They started paying dividends again in 2012, and the dividend per share has grown steadily since then.
The Peers Dividend Scores report is eye-opening. It shows that Hewlett Packard Inc. (HPQ) currently offers a much higher dividend yield, but Apple leads in dividend growth.
I use these tools to research a company’s financials before making investment decisions. They help me spot trends, compare companies, and get a clear picture of a stock’s dividend potential.
6. Invest in Stocks & Manage Your Portfolio
If you picked Stock Rover to screen stocks, you can link it to your broker. This gives you better reports on your portfolio than most brokers offer. You’ll still buy and sell stocks through your broker, but Stock Rover will track how your portfolio is doing.
To set this up, click on Brokerage Connect in the left menu and follow the steps.
7. Effectively Manage Your Portfolio with Comprehensive Dividend Income Reporting
You can link Stock Rover to your broker or add your stocks manually by uploading a text file. Either way, you’ll get nice reports about your portfolio.
Let’s take Warren Buffett’s Top 25 Holdings as an example. Stock Rover has already created this portfolio, which shows the 25 companies Buffett owns the most.
If we look at the Value Over Time tab, we can see:
- The portfolio grew 7.3% per year over 10 years
- The stocks went up 88.1% in value
- The total return was 116%
- It made $26 million in dividends

These tools can help you monitor your stocks’ performance. They show you if you’re making money and how much income your dividends are bringing in. This information can help you decide whether to make changes to your portfolio.
23 Important Dividend Stock Screening Criteria
- Dividend Yield: Dividend yield is a crucial metric when screening dividend stocks. It’s the annual dividend payment divided by the stock price, expressed as a percentage. I look for yields between 1.5% and 6%, as anything higher might signal unsustainability.
- Payout Ratio: The payout ratio tells me what percentage of a company’s earnings are paid out as dividends. I use this to gauge dividend sustainability and growth potential. A lower ratio often suggests room for future dividend increases.
- Free Cash Flow Payout Ratio: I find this metric more accurate than the standard payout ratio. It uses free cash flow instead of earnings, giving a clearer picture of a company’s ability to sustain dividends. I aim for ratios below 70%.
- Dividend Coverage Ratio: This ratio shows how many times a company can pay its dividend using its earnings. I look for values above 1.5, which indicate that the dividend is well-covered by profits.
- Dividend Cash Flow: I use this to see how much a company has spent on dividend payments over the past year. It helps me understand the cash commitment to shareholders.
- Dividend 1-Year Chg (%): This metric shows me the year-over-year change in dividend payments. I use it to spot recent dividend growth trends.
- Dividend 3-Year Avg (%): I look at the average annual dividend growth over three years to get a medium-term view of a company’s dividend policy.
- Dividend 5-Year Avg (%): This gives me a longer-term perspective on dividend growth. I use it to identify companies with consistent dividend increases.
- Dividend 10-Year Avg (%): I find this metric invaluable for assessing long-term dividend growth. It helps me spot dividend aristocrats and kings.
- Expected Dividend Growth Rate: I use this forward-looking metric to gauge market expectations for future dividend growth. It’s based on analyst forecasts and company guidance.
- Forward Dividend Growth: This shows me the expected change in dividend payments for the coming year. I find it useful for identifying companies likely to increase their dividends soon.
- Dividend Yield Industry Decile: I use this to compare a stock’s dividend yield to others in its industry. A score of 1 indicates a top 10% yield within the industry.
- Dividend Yield Sector Decile: This is similar to the industry decile but for the broader sector. I use it for sector-wide yield comparisons.
- Dividend Per Share: This tells me the actual dollar amount paid per share annually. I compare it to the stock price to assess income potential.
- Next Dividend Payment Per Share: I use this to know the exact amount of the upcoming dividend payment. It’s helpful for short-term income planning.
- Expected Yearly Dividends: This metric shows me the total annual dividend income I can expect from a particular holding. It’s useful for portfolio income projections.
- Percent of Expected Yearly Dividends: This helps me understand how much of my portfolio’s dividend income comes from each stock, aiding in diversification and income planning.
- Dividend Frequency: This tells me how often a company pays dividends. I use it to plan my cash flow and reinvestment strategy.
- Dividend Payment Date: Knowing when dividends are paid helps me manage my cash flow and reinvestment timing.
- Dividend Record Date: This is the cut-off date for dividend eligibility. If I want to receive the next dividend, I must buy stocks before this date.
- Ex-Dividend Date: This date is crucial for dividend capture strategies. Stocks bought on or after this date won’t receive the next dividend payment.
- Dividends Rating Score: I use Stock Rover’s proprietary score to quickly assess a stock’s dividend quality compared to its peers.
- Consecutive Dividend Growth Years: This metric helps me identify dividend aristocrats and kings. I look for stocks with long streaks of consecutive dividend increases.
Summary
A dividend stock screener is a powerful tool for investors looking to find quality dividend-paying stocks. I’ve found that using a screener can save time and help narrow down the vast array of options in the market.
When using a dividend screener, I focus on key metrics like:
- Dividend yield
- Payout ratio
- Dividend growth rate
- Years of consecutive dividend increases
I also look at financial health indicators such as:
• Debt-to-equity ratio
• Return on equity
• Profit margins
• Free cash flow
It’s important to set criteria that match your investing goals. For example, if you’re seeking income, you might prioritize high yields. If you want long-term growth, look for stocks with consistent dividend increases.
Many online brokers and financial websites offer free dividend screeners. I like to compare results from different screeners to get a well-rounded view. Once I have a list of potential stocks, I delve deeper into each company’s financials, business model, and prospects.
FAQ
Why is dividend stock screening important?
I use dividend stock screening to identify companies that consistently pay dividends, which can provide steady income in various market conditions.
What is the payout ratio in dividend stock screening?
The payout ratio shows me what percentage of earnings a company pays as dividends. I use it to assess dividend sustainability.
What is a good dividend yield for a stock?
I generally look for yields between 1.5% and 6%. Anything higher might be risky, while lower yields might not justify the investment.
What is a sustainable payout ratio?
I consider payout ratios below 75% as generally sustainable, but this can vary by industry.
Do all stocks pay dividends?
No, not all stocks pay dividends. I’ve noticed that growth companies often reinvest profits instead of paying dividends.