I’ve spent 25 years exploring stock charting tools, and I’m excited to share my findings with you. Free options have come a long way, offering features that used to cost a fortune.
These tools offer powerful charts, real-time data, and even community features. I’ll explain what makes each one special and how they can improve your trading.
Editors Choice Award for Free Stock Charts
TradingView is my top free pick for its 160 indicators, global community, and coverage of stocks, Forex, commodities, and ETFs. For fundamental analysis, I really like Stock Rover. Its 10-year financial screening database helps me spot growth, dividend, and value opportunities. Benzinga Pro provides awesome real-time news and charts. Finally, Finviz has fast screening and technical analysis.
All these programs give investors useful data without costing anything.
Top Free Stock Chart Mobile Apps
There are very few top-quality free stock charting apps available on mobile.TradingView is my top pick, and it has strong mobile charts that I often use. TC2000 is another good choice for scanning the market on my phone. These apps help me track stocks and analyze trends wherever I am.
1. TradingView: Awesome Free Charts and Community
I love TradingView for its free stock charting and active community. It’s packed with features like news, watchlists, and screening tools. The basic version is free, but there are ads. If you want to go ad-free, you can try their paid plans.
| TradingView Rating | 4.8/5.0 |
| Free Features | Charts, trading, news, watchlists, screening, backtesting, and an app! |
| Premium Features | Multiple Layouts & Charts, Alerts, Publishing, ad-free |
| Best for | Stock, & Currency Traders |
| Free Version | ✅ TradingView Free |
| Premium Trial | Free 30-Day |
| Markets Covered | US, India, Europe, Asia |
TradingView is great for stocks, Forex, and crypto. It’s easy to use and has tons of indicators and drawing tools. I find the social features really helpful – you can share your charts and learn from others.
The free version includes real-time scanning and filtering. You can even look at economic data from the Federal Reserve. The watchlists show lots of financial info that updates every minute.
✂ Save 16% With a TradingView Annual Subscription ✂
My research reveals that TradingView is the ultimate free stock charting software! With the largest selection of exchanges worldwide, it’s a game-changer for international investors. But it doesn’t stop there—TradingView offers more than just stock charts; you’ll find charts for ETFs, Futures, Forex, Bonds, and Cryptocurrency, all at no extra cost!
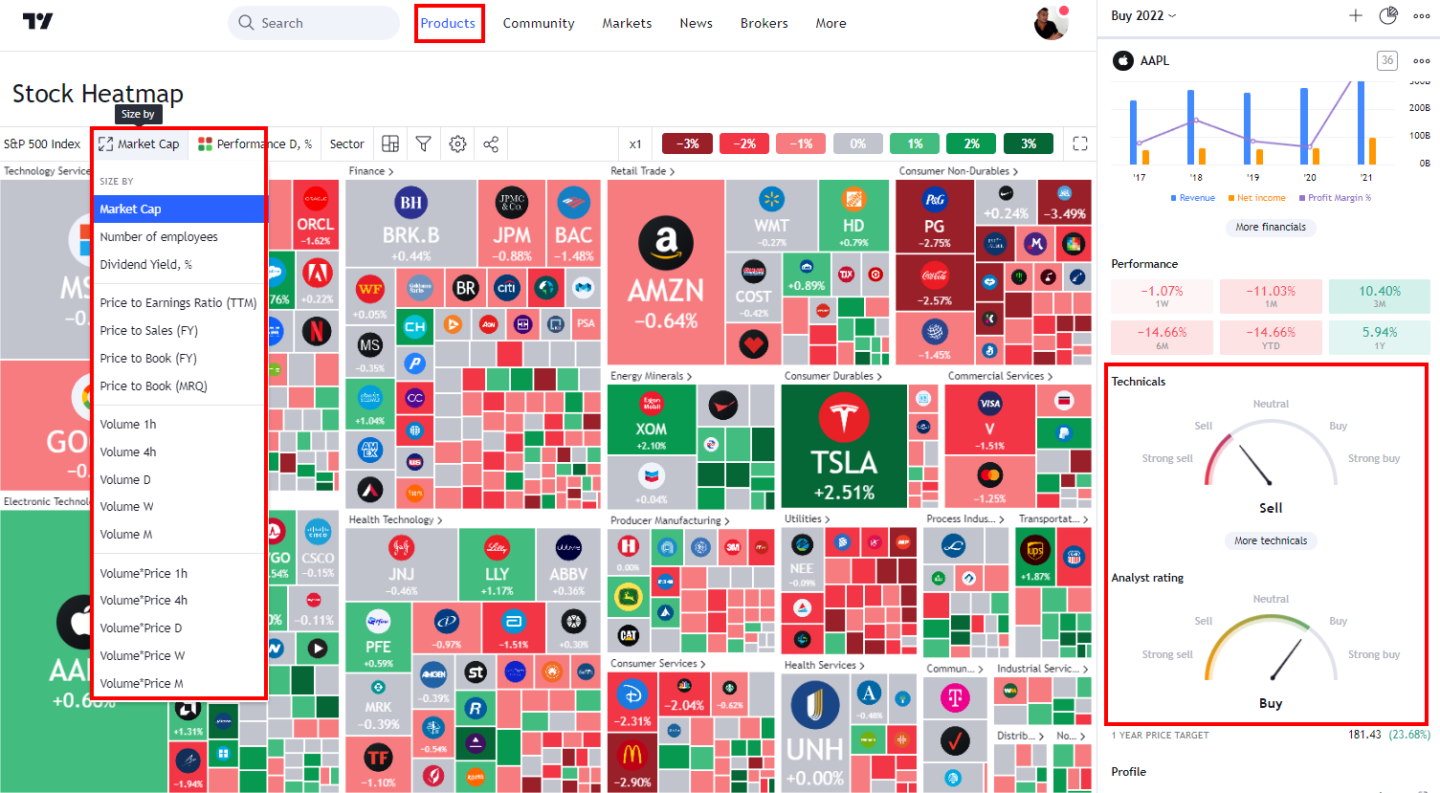
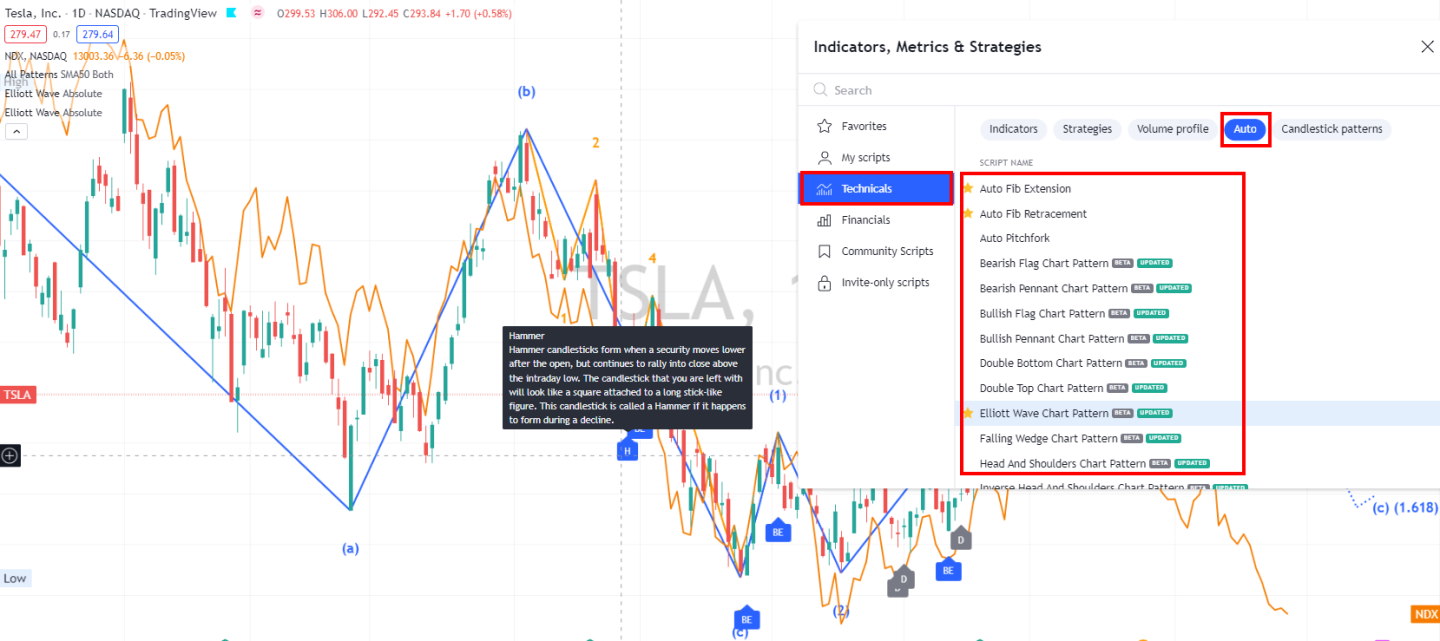
As an advanced trader, you’ll love the over 160 indicators and specialty charts like LineBreak, Kagi, Heikin Ashi, Point & Figure, and Renko—everything you need to elevate your trading game. Plus, TradingView boasts an impressive array of drawing tools, including unique options like extensive Gann & Fibonacci tools. With 65 drawing tools and hundreds of icons at your fingertips, your charts, notes, and ideas will come to life like never before!
I’m impressed by how TradingView handles economic indicators. You can compare unemployment rates and company profits on one chart—that’s pretty powerful stuff!
The mobile app is also top-notch. It’s simpler than the desktop version, but it still works great. Thanks to its smart design, TradingView runs smoothly on any device.
For US traders, you can link TradingView with TradeStation to trade stocks directly from your charts. European users can connect with FXCM and Saxo Group for currencies and CFDs.
2. Stock Rover: Deep Dive into Stock Analysis
Stock Rover is my go-to for free stock analysis and research. It’s packed with 10 years of financial data and over 350 metrics, making it perfect for growth, value, and dividend investing strategies.
| Stock Rover Rating | 4.7/5.0 |
| Free Features | Charts, Financial Screening, Broker Integration |
| Premium Features[exceptional- | 10-Year Financial Database, Portfolio Mgt, Advanced Screening |
| Best for | Growth, Dividend & Value Investors |
| Free Version | ✅ Try Stock Rover |
| Premium Trial | Free 14-Day |
| Markets Covered | USA |
The free version lets you research and screen over 10,000 stocks and ETFs. You also get a news feed and portfolio management tools. But the real magic happens with their paid plans.
✂ Save 25% on Stock Rover ✂
The leader in professional stock screening, research, and portfolio management.
Save 25% Sign Up for a Premium Stock Rover Trial
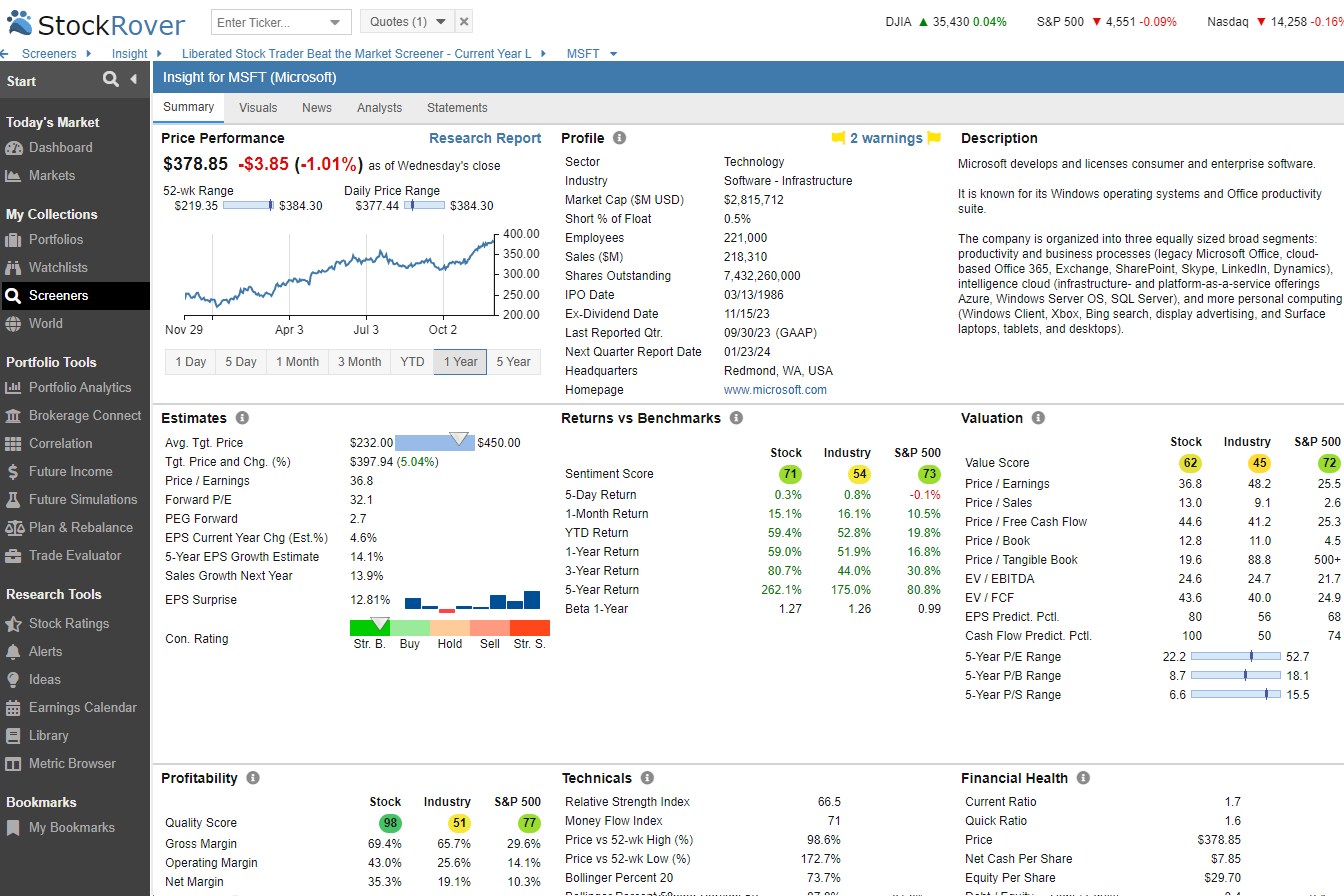
Stock Rover’s charts are different from those of other free tools. Instead of focusing on price and volume, they show fundamental financial strength indicators. This is great for long-term investors looking at income, growth, and value.
Stock Rover transforms stock analysis with its innovative research reports, providing free insights that are both detailed and easy to understand. These reports seamlessly blend a company’s historical and forecasted financial data into a comprehensive, unbiased analysis. With real-time updates on a company’s financial health, earnings, and analyst consensus estimates, you’re equipped with the information you need to make informed decisions. Plus, you can easily download these insightful reports in PDF format for all Dow Jones 30 Index component companies!
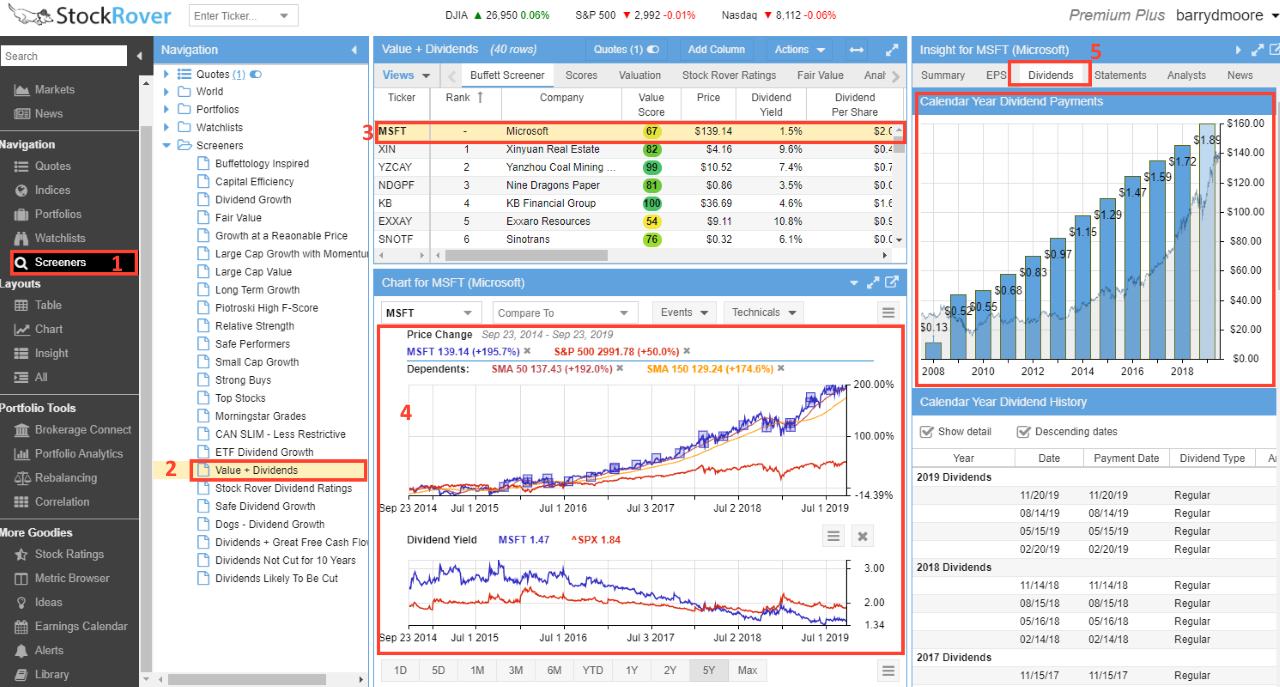
But that’s not all—testing shows that Stock Rover empowers you to craft a savvy value investing portfolio by incorporating a robust set of Fair Value and Margin of Safety calculations. This means you can rank stocks based on their undervaluation, leveraging the tried-and-true forward cash flow and fair value metrics championed by investment legends Benjamin Graham and Warren Buffett. Dive into the world of smarter investing with Stock Rover!
I find their research reports super helpful. They combine historical and future financial data into an easy-to-read analysis, which is a great way to get a quick snapshot of a company’s health.
3. Benzinga Free: Real-time News and Charts
Benzinga Pro is a game-changer for traders who need up-to-the-minute news and charts. The free version gives you access to real-time news updates and basic charting tools.
What I love about Benzinga Pro is how fast it delivers market-moving news. You get alerts on earnings releases, SEC filings, and analyst ratings changes as they happen, which can be a huge advantage when making trading decisions.
| Benzinga Pro Rating | 4.5/5.0 |
| ⚡ Free Features | Charts, Realtime News, Financials, Market Movers [No Adverts] |
| 🏆 Premium Features | Charts, Real-time News, Financials, Market Movers [No Adverts] |
| 🎯 Best for | Traders |
| 🆓 Free Version | ✅ Benzinga Pro Free |
| 🎮 Free Premium Trial | 14-Day |
| 🌎 Markets Covered | USA |
Benzinga offers an exciting service for free, hoping you’ll fall in love and decide to upgrade to their premium options. Why should you consider upgrading? Because staying ahead of market-moving news can give you a significant edge as a trader! Their paid services come packed with high-value benefits like advanced newsfeed filtering, insider trading insights, and block trade alerts—tools that can be incredibly lucrative for savvy traders.
✂ Save 37% on Benzinga Pro Real-time News & Options Mentor ✂
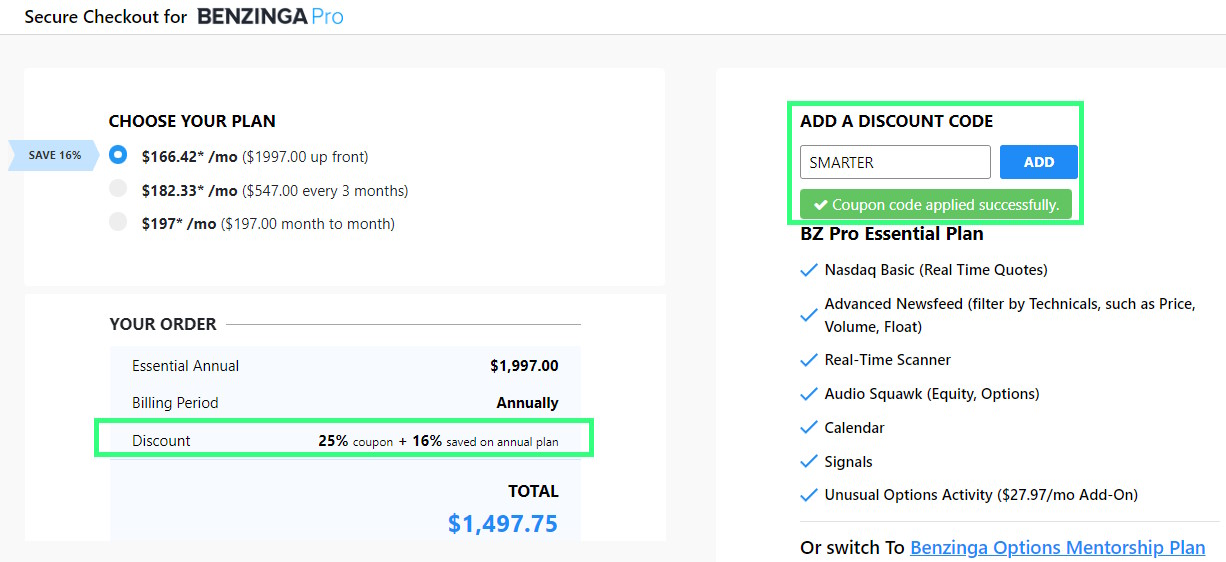
If you’re considering an upgrade, I highly recommend the Benzinga Pro Essentials package. It includes all these amazing features, along with real-time chart quotes and alerts for unusual market activity.
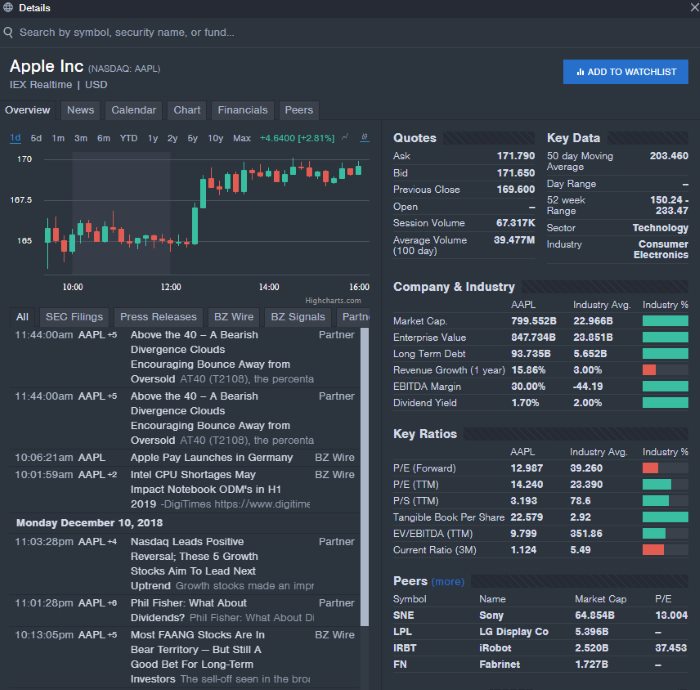
At the heart of the Benzinga Pro service is the real-time newsfeed, designed to keep you updated quickly and effectively. BZWire delivers crucial updates, including all Securities & Exchange Commission (SEC) news and real-time PR announcements, which can be game-changers since SEC and FDA updates often have a major impact on stock prices. Don’t miss out on the opportunity to elevate your trading game!
Also, important company PR announcements are timed to coincide with or counteract the news, so receiving these as quickly as possible is a serious bonus.
The charts are pretty good, too. They’re not as advanced as TradingView, but they get the job done. You can add technical indicators and draw trendlines to help with your analysis.
Benzinga Pro also offers a watchlist feature for tracking your favorite stocks. The interface is clean and easy to use, which I really appreciate when I’m trying to stay on top of a busy market.
4. Finviz: Quick Charts & Powerful Screening
Finviz is my secret weapon for fast stock charting and screening. The free version offers a ton of value, especially if you’re into technical analysis.
| Finviz Rating | 4.4/5.0 |
| Free Features | Charts, News, Watchlists, 50 Screener Configs, Heatmaps |
| Premium Features | Realtime data, Alerts, Correlation Charts, Backtesting, Data Export, eight years of Financial Statements |
| Best for | Beginner Investors & Traders |
| Free Version | ✅ Try It For Free |
| Premium Trial | 30-Day Money-Back |
| Premium Discount | -40% With Annual Plan |
| Markets Covered | USA |
The charts on Finviz are simple but effective. You can quickly switch between different timeframes and add basic technical indicators. What I really like is how fast the charts load – it’s great when you’re trying to scan through a lot of stocks quickly.
But where Finviz really shines is its stock screener. You can filter stocks based on a wide range of criteria, from basic stuff like market cap and P/E ratio to more advanced technical indicators. It’s a powerful tool for finding trading opportunities.
The Finviz screener is your go-to tool for swiftly filtering through over 8,500 major stocks and ETFs! While it doesn’t cover every stock—there are more than 10,000 in the USA alone—it focuses on the heavyweights that matter.
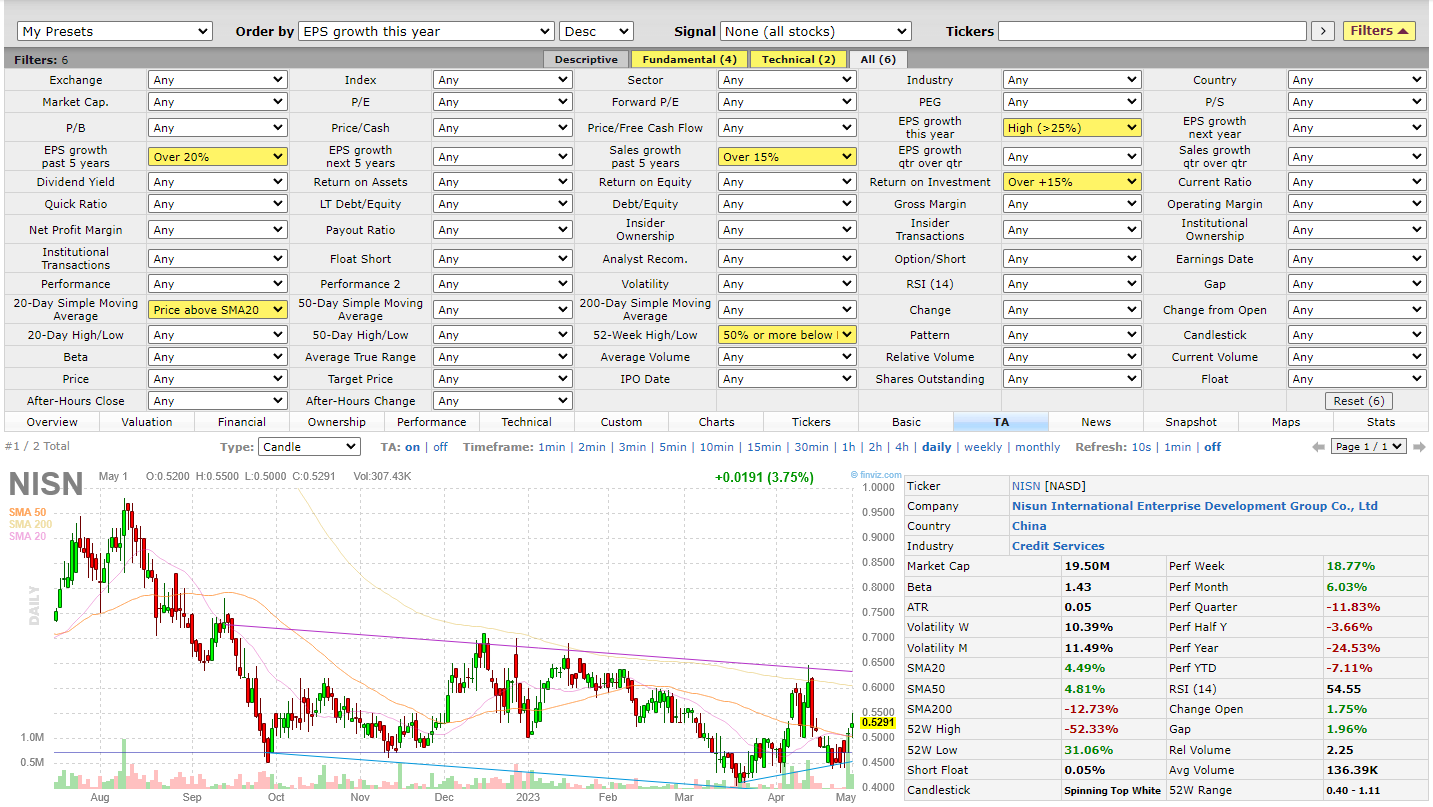
With its lightning-fast performance, the Finviz stock screener lets you filter based on 67 essential fundamental and technical criteria. Want to pinpoint specific chart signals? You can easily track new highs, lows, oversold conditions, analyst upgrades, insider buying, and even classic chart patterns like double tops and head-and-shoulders!
Mix and match 67 key fundamental criteria and 30 unique trading signals to craft the perfect stock screening strategy. Dive in and discover the potential that awaits!
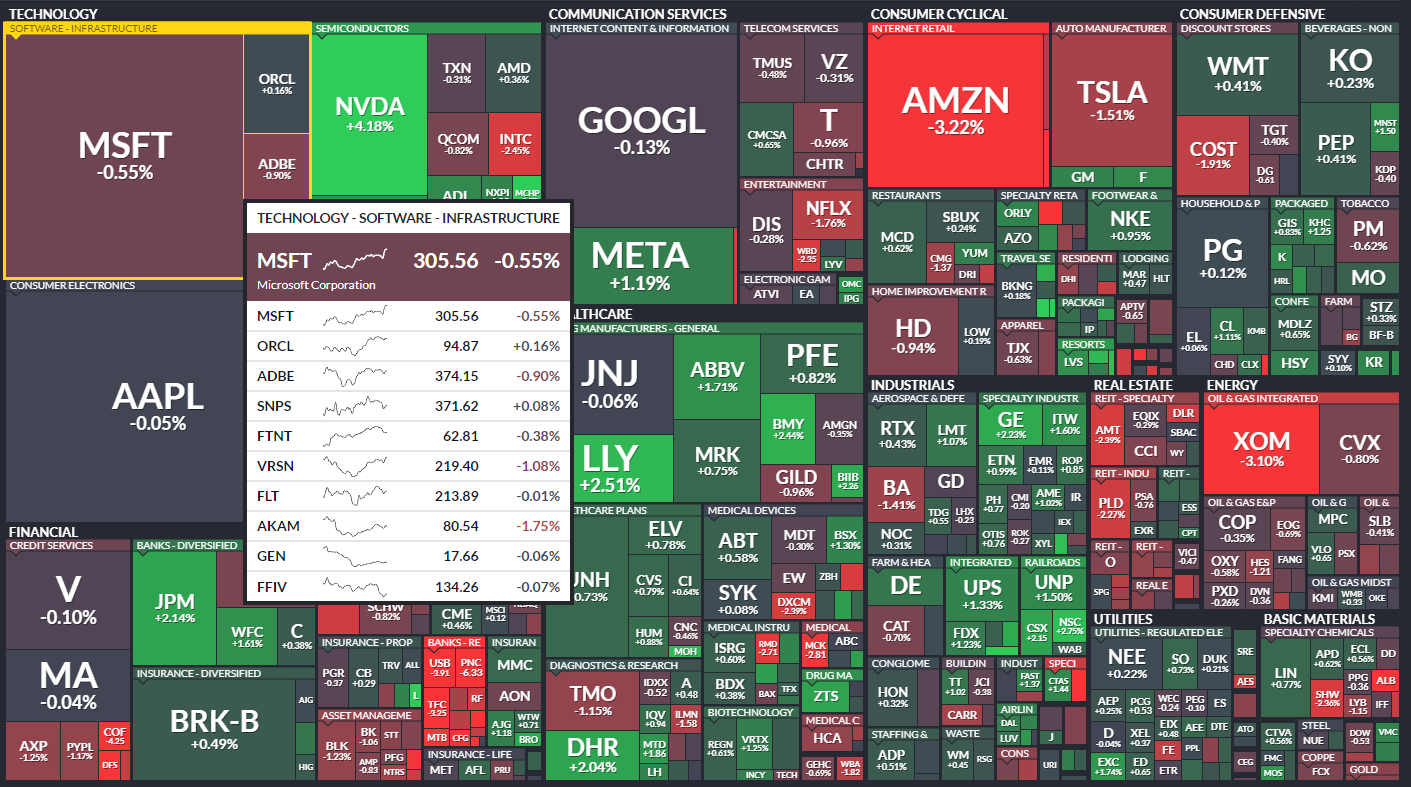
Finviz also offers a cool heat map feature that shows you which sectors are hot and which are not. I find this really useful for getting a quick overview of market trends.
5. TC2000: Free Charts for Technical Analysis Fans
TC2000 is a hidden gem for technical analysis enthusiasts. The free version, called TC2000 Freestocks, offers some solid charting tools that can rival paid platforms.
| TC2000 Rating | 4.3/5.0 |
| Free Features | Daily Charts, Indicators, 1 Watchlist, Options Chains, Paper Trading |
| Premium Features | Multiple Layouts & Charts, Alerts, Screening, Trading, Custom Indicators |
| Best for | Stock & Options Traders |
| Free Version | TC2000 Free |
| Premium Trial | Free 30-Day |
| Premium Discount | -25% for Bi-Annual Subscription |
| Markets Covered | Global |
What I love about TC2000 is its clean, user-friendly interface. The charts are crisp and easy to read, which is crucial when you’re doing detailed technical analysis.
You can add a variety of technical indicators to your charts, including moving averages, MACD, and RSI. The drawing tools are also pretty good – you can add trendlines, Fibonacci retracements, and more.
TC2000 has an excellent array of technical indicators and drawing tools; all the big ones are there, from OBV, RSI, and Bollinger Bands to Fibonacci Fans and Andrews Pitchfork. With over 240 different indicators, you will have plenty to play with.

TC2000 also offers a free basic scanning tool. While not as powerful as their paid offerings, it’s still useful for finding stocks that meet certain technical criteria.
One cool feature is the ability to create your own custom formulas for indicators. This is great if you have a specific strategy you want to test or implement.
As a US investor, I know there are numerous benefits to utilizing TC2000. These advantages encompass user-friendliness, affordability, responsive customer service, robust stock screeners, and exceptional technical analysis tools. The most recent version of TC2000 introduces even more valuable features, such as Brokerage Integration.
My Top Picks
I’ve tested many free stock charting platforms, and a few really stand out. TradingView is great for global charting and connecting with other traders. I love Stock Rover for digging into value, income, and growth stocks. When I need breaking news fast, Benzinga Pro is my go-to. Finviz wins for quick and reliable stock screening.
The free charting world is packed with options, but these are the cream of the crop. They all offer solid free plans, with paid upgrades if you need more. Your best choice depends on what you’re looking for. As a new investor with a small portfolio, these free tools are perfect to get started.
As your investing skills and account grow, you might want to look at paid pro-level AI trading software. But for now, these free options pack a serious punch. Give them a try and see which one clicks for you.
Happy charting!