I am excited to share my insights on TradingView, a widely recommended platform for traders in the US and internationally. With 25 years in trading and my certification as a Financial Technician, I can confidently say that TradingView stands out due to its exceptional stock chart analysis, pattern recognition, screening, and backtesting capabilities.
As a long-time user and paid subscriber of TradingView, I find its features highly reliable for daily trading activities. With 20 million users and integrated live trading, it offers continuous trading inspiration.
My goal is to provide you with an overview of both its free and pro services, helping you decide if it’s the right platform for your trading needs.

Review Test Results & Ratings
I’ve spent a lot of time testing and rating various features. Here’s a breakdown:

TradingView Rating: 4.7/5.0
| Pricing: ★★★★★ | News & Social: ★★★★★ |
| Software: ★★★★★ | Backtesting: ★★★★✩ |
| Trading: ★★★★✩ | Pattern Recognition: ★★★★✩ |
| Scanning: ★★★★✩ | Candlestick Recognition: ★★★★★ |
| Charts & Analysis: ★★★★★ | Usability: ★★★★★ |
| Features | Rating ★★★★★ |
|---|---|
| Buy/Sell Signals | ✅ |
| Automatic Trade Execution | ✅ |
| Trendline Recognition | ✅ |
| Chart Pattern Recognition | ✅ |
| Candlestick Recognition | ✅ |
| Backtesting | ✅ |
| Code-Free Backtesting | ❌ |
| Auto-Trading Bots | ✅ |
| Markets Covered | Global, USA, India, Europe, Asia |
| Assets | Stocks, Crypto, Fx, ETFs, Futures |
| Free Trial | ✅ |
| Community & Chat | ✅ |
| OS | Web Browser, Windows |
| Price/Month | From $12.95 |
| Discount Available | $15 Discount & 16% Annual Plan Discount |
✂ Save 16% With a TradingView Annual Subscription ✂
The software excels in many areas. The top scores were in Charts & Analysis, Pattern Recognition, and Candlestick Recognition. The only features that didn’t get perfect scores were Trading, Screening, and Backtesting, but it still ranked highly.
My Verdict
TradingView stands out as the best option for international stock, FX, and crypto traders. With features like a global community, heatmaps, and broker integration, it’s a fantastic all-rounder.
One of its best qualities is its ability to identify chart and candlestick patterns automatically. This makes it perfect for technical analysis. Its strong backtesting features and vibrant trading community are big pluses for international users.
The platform shines in its scanning and charting tools, which are great for day and swing traders. However, for those interested in long-term growth or value investing, other options like Stock Rover might be better.
TradingView has top-notch social integration with chat, news, and the chance to follow and interact with other traders. The global stock exchange data further cements its place as the leader in stock charting analysis.
Key Features
Here are some features you’ll love:
- Charts: Easy and quick to use.
- News: Stay updated with the latest information.
- Watchlists: Keep track of your favorite stocks, forex, and crypto.
- Screening: Find the best opportunities.
Unique Features
- Trading: Execute trades directly.
- Backtesting: Test your strategies with past data.
- Community: Connect with other traders.
Subscription Options
- Free Option: Basic access for free.
- Trial: Try it free for 30 days.
- Discount: Get 16% off by signing up for an annual subscription.
Accessibility
- Operating System: Works in any web browser.
- Region: Available globally.
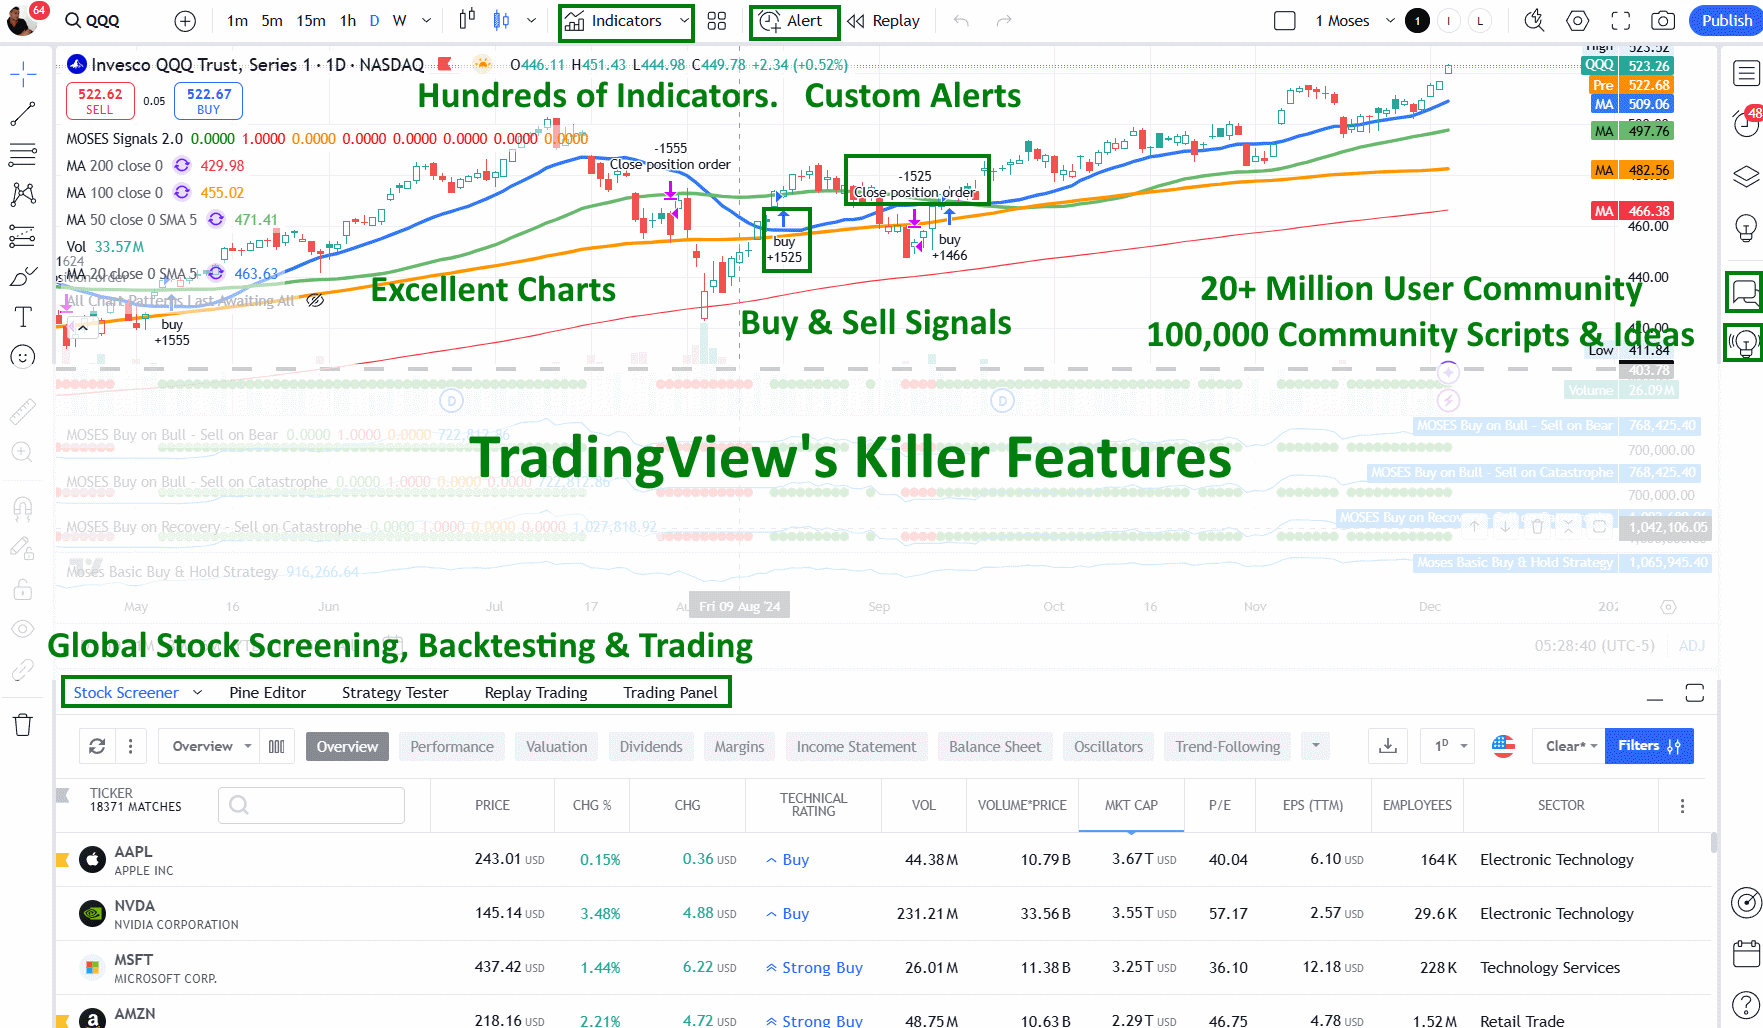
TradingView Overview
TradingView is a global platform for traders, boasting 20 million active users. It offers comprehensive tools for charting, screening, and analyzing stocks, indices, ETFs, and cryptocurrencies. With its cloud-based design, TradingView combines charts, indicators, strategy development, and backtesting. The community aspect allows users to share trading ideas and learn together.
Pros
- Twenty million users make it an ideal place to learn.
- You can trade directly from charts.
- Excellent screening and chart analysis.
- Supports all global stock exchanges.
- Over 100,000 user-generated strategies.
- Affordable.
- User-friendly and easy to set up.
- Flexible backtesting using Pine Script.
Cons
- Not suitable for value or dividend investors.
- Lacks features for stock options.
Pricing
TradingView Basic: This is the free option. You get charting, trading, screeners, and three indicators per chart. While it’s ad-supported, it’s a good introduction to the platform.
TradingView Pro: This ad-free plan offers two charts per layout, five indicators per chart, and 20 alerts for $14.95 per month. It’s perfect for beginners and intermediate traders who need more capabilities.
TradingView Pro+: At $29.95 per month, this plan includes ten indicators per chart, 100 alerts, and ten chart layouts. This plan strikes a nice balance between features and cost, making it suitable for more serious traders.
TradingView Premium: Costing $59.95 per month, Premium is geared towards advanced traders who need unlimited capabilities. This plan allows you to develop and publish indicators and strategies.
| Plan | Monthly Cost | Indicators per Chart | Alerts | Charts per Layout | Key Features |
|---|---|---|---|---|---|
| Basic | $0 | 3 | 1 | 1 | Ad-supported |
| Pro | $14.95 | 5 | 20 | 2 | Full social access |
| Pro+ | $29.95 | 10 | 100 | 10 | Best functionality/price |
| Premium | $59.95 | Unlimited | Unlimited | Unlimited | Develop and publish tools |
Based on my experience, I recommend the Pro+ plan for its balance of cost and features. It’s ideal for those looking to get serious without breaking the bank.
Can You Use TradingView for Free?
Yes, you can use TradingView for free with the Basic plan. Even though it is ad-supported, you’ll still have access to stock analysis, screening tools, and community ideas. The free version does have some limitations, such as allowing only one saved chart per workspace and showing ads.
How to Get TradingView Pro for Free
To get TradingView Pro for free, just sign up for a free trial. You’ll enjoy all Pro features for 30 days without paying anything. This is the only way to experience TradingView Pro at zero cost.
Is TradingView Pro Worth It?
I think TradingView Pro is definitely worth the investment. It gives access to powerful indicators, charts, and alerts. With full community access and beefed-up technical analysis, TradingView Pro and Pro+ options help me make smarter trading decisions.
Platform
TradingView offers live data through its Pro, Pro+, or Premium plans. While some markets might require an additional fee for realtime data, TradingView’s costs are much lower than others in the industry. You only have to pay $2 per month per market, whereas competitors often charge between $10 and $15 per month.

Try TradingView Pro Free for 30 days.
You can access data from 13 American stock markets, 9 European markets, and 30 Asian markets. This also includes major cryptocurrency exchanges, forex markets, and commodity futures. With TradingView, I can have all this information readily available without paying a fortune.
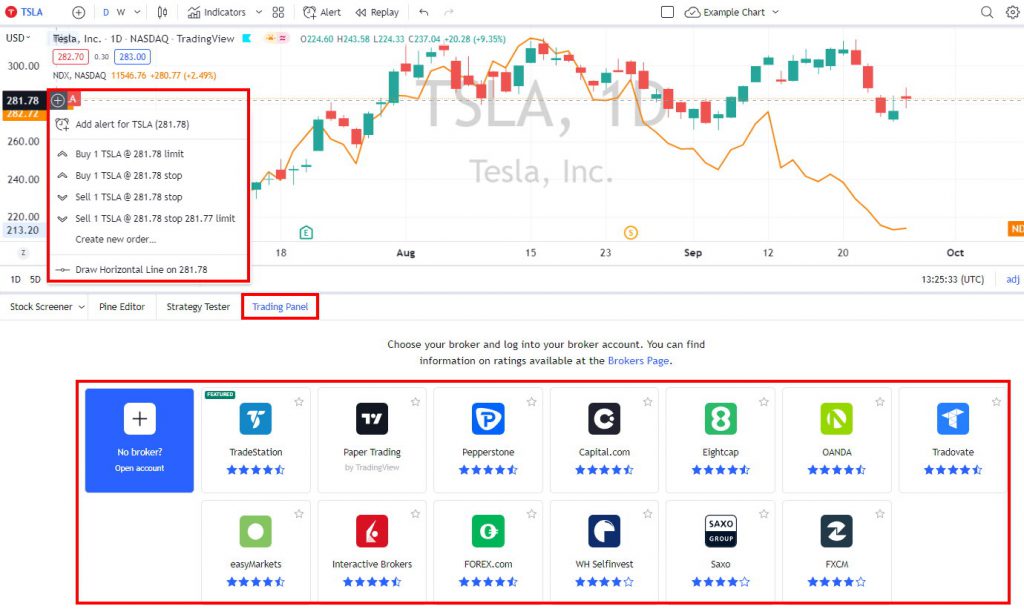
Trading
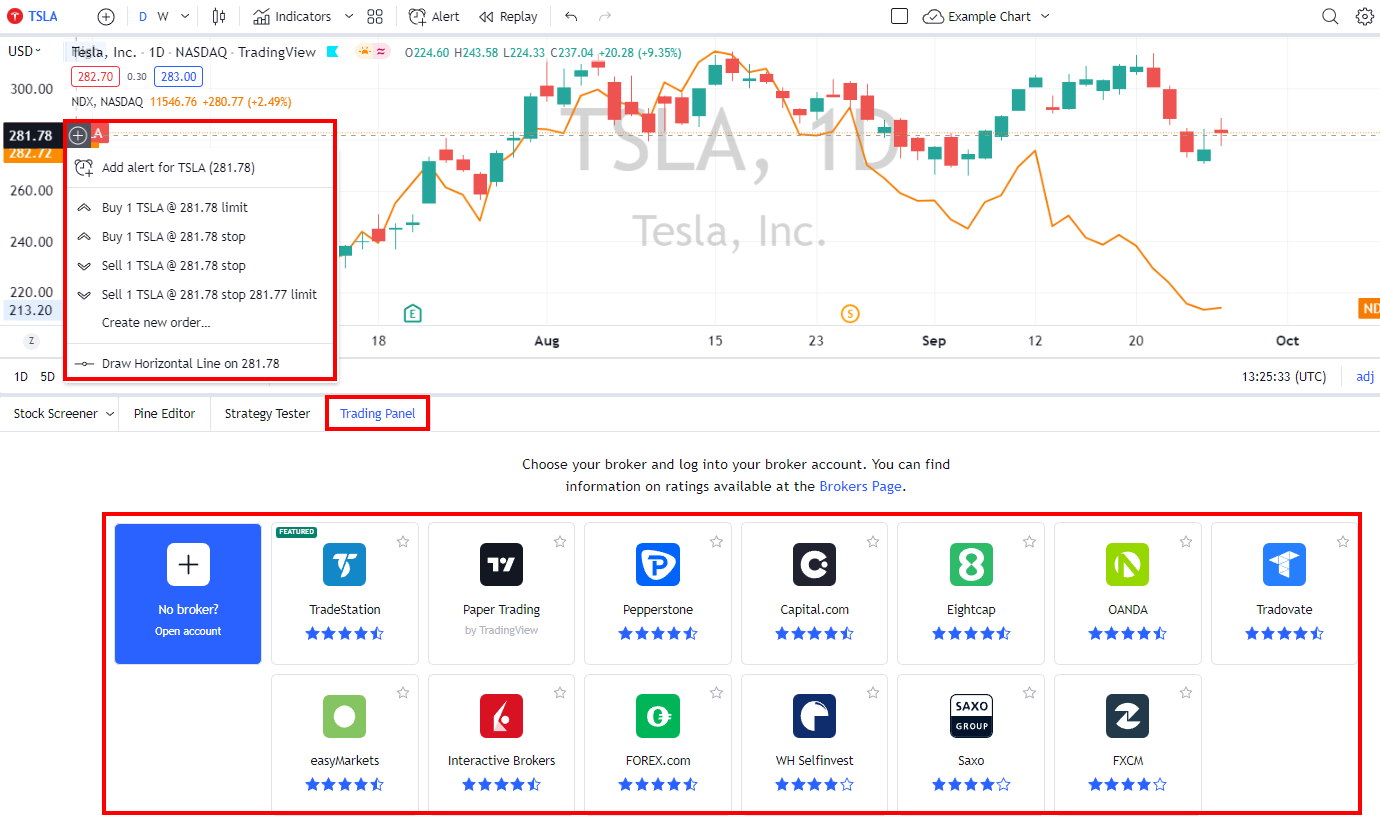
Steps to Paper Trade with TradingView
I find that TradingView makes paper trading really straightforward. To start, all you need is any of their subscription plans. When you’re looking at a chart, click the “Buy” button and then choose “Paper Trading.” It’s a great way to practice without risking real money.
Is TradingView Suitable for Day Trading?
In my opinion, TradingView is an excellent option for day traders. It offers broker integration for free stock trades and provides real-time exchange data. It also offers powerful tools for pattern recognition and backtesting that make trading easier and more efficient for day traders.
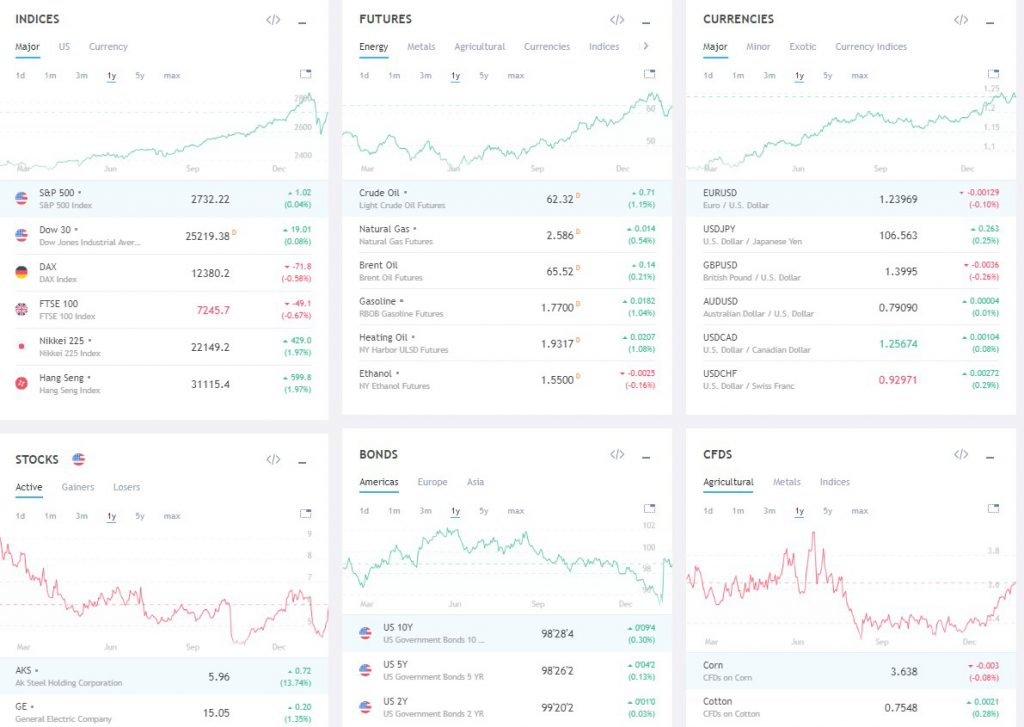
What Assets Can I Trade Using TradingView?
TradingView is versatile and supports all trading assets. Here are some examples:
- Stocks: Covers 90% of stock markets globally.
- Forex (FX) Currencies: Includes Major, Minor, and Exotic currencies.
- Futures: You can trade on energy, metals, agriculture, indices, and even interest rates.
- Cryptocurrencies: Supports 26 cryptocurrencies like Bitcoin, Ripple, Ethereum, and Bitcoin Cash.
- Bonds: Over 30 types of government bonds are available.
Can I Trade Bitcoin on TradingView?
Yes, trading Bitcoin is possible on TradingView, but mainly outside the USA. You need to set up an account through a CFD (Contract for Difference) Broker. It’s a bit like trading a gold ETF; you won’t hold the physical asset but can engage in virtual trades that reflect current market prices.
Analysis & Charts
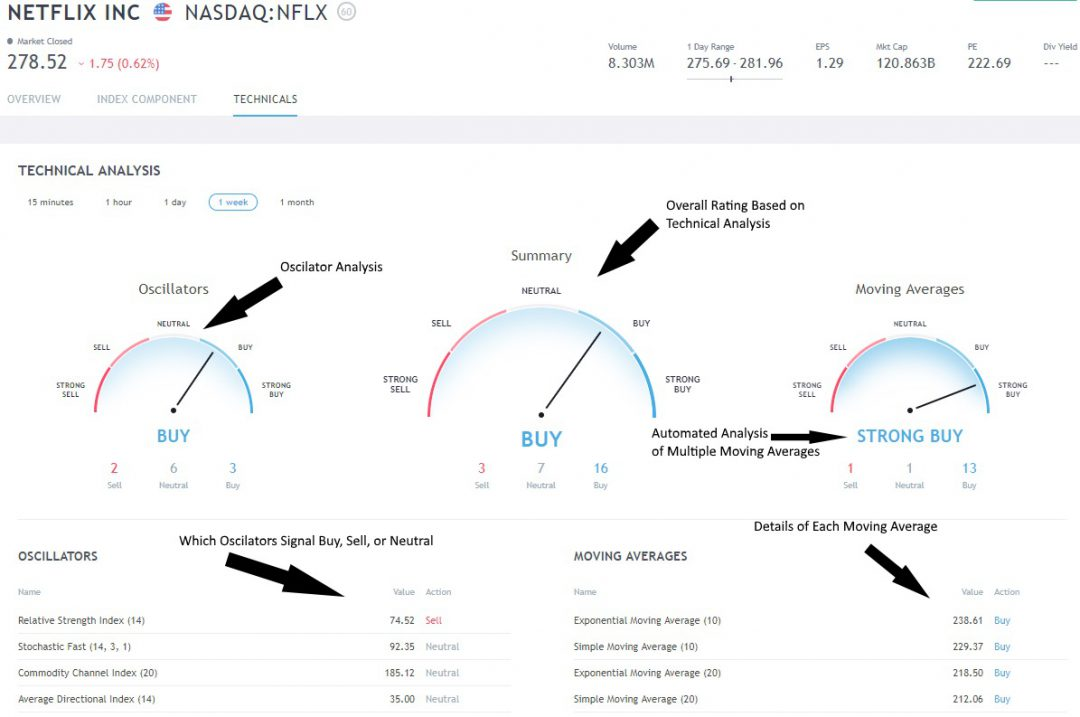
Automated Stock Indicator Evaluations
This tool saves you time by giving quick insights into whether indicators are bullish, bearish, or neutral. The ratings include moving averages and oscillators based on price and volume. In my experience, TradingView’s buy and sell indicators are good for gauging sentiment. You can see this reflected in the Fear & Greed Index Dashboard on the platform.
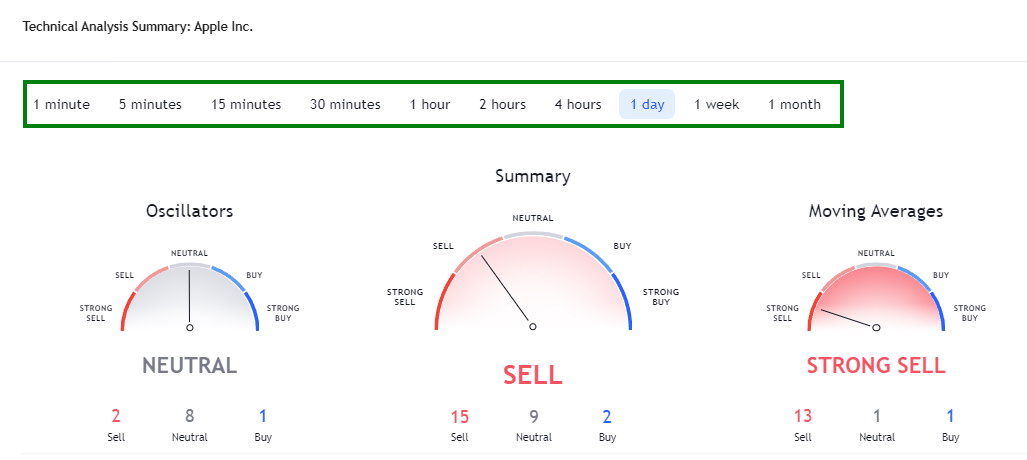
When you open a chart and click “Technicals,” you’ll see three dials. The left dial displays oscillators like the relative strength index (RSI), stochastics, and the Average Directional Index. The right one shows different Moving Averages, including Simple, Exponential, and Ichimoku Cloud.
Each indicator averages to give an overall rating—Buy, Sell, or Neutral. It’s a user-friendly way to implement automated technical analysis.
I’m really impressed with the variety of charts available, such as Kagi, Heikin Ashi, and Renko, as well as point-and-figure and Line-Break charts. The community has even created some unique indicators, like Moon Phase.
This wide selection of charts is great for advanced traders. Also, with a Premium membership, you get Level II data fully integrated. Kudos to TradingView for that.
They’ve also added Darvas Box, Elliot Wave, and Point & Figure charts for more experienced technical analysts. It’s an impressive package.
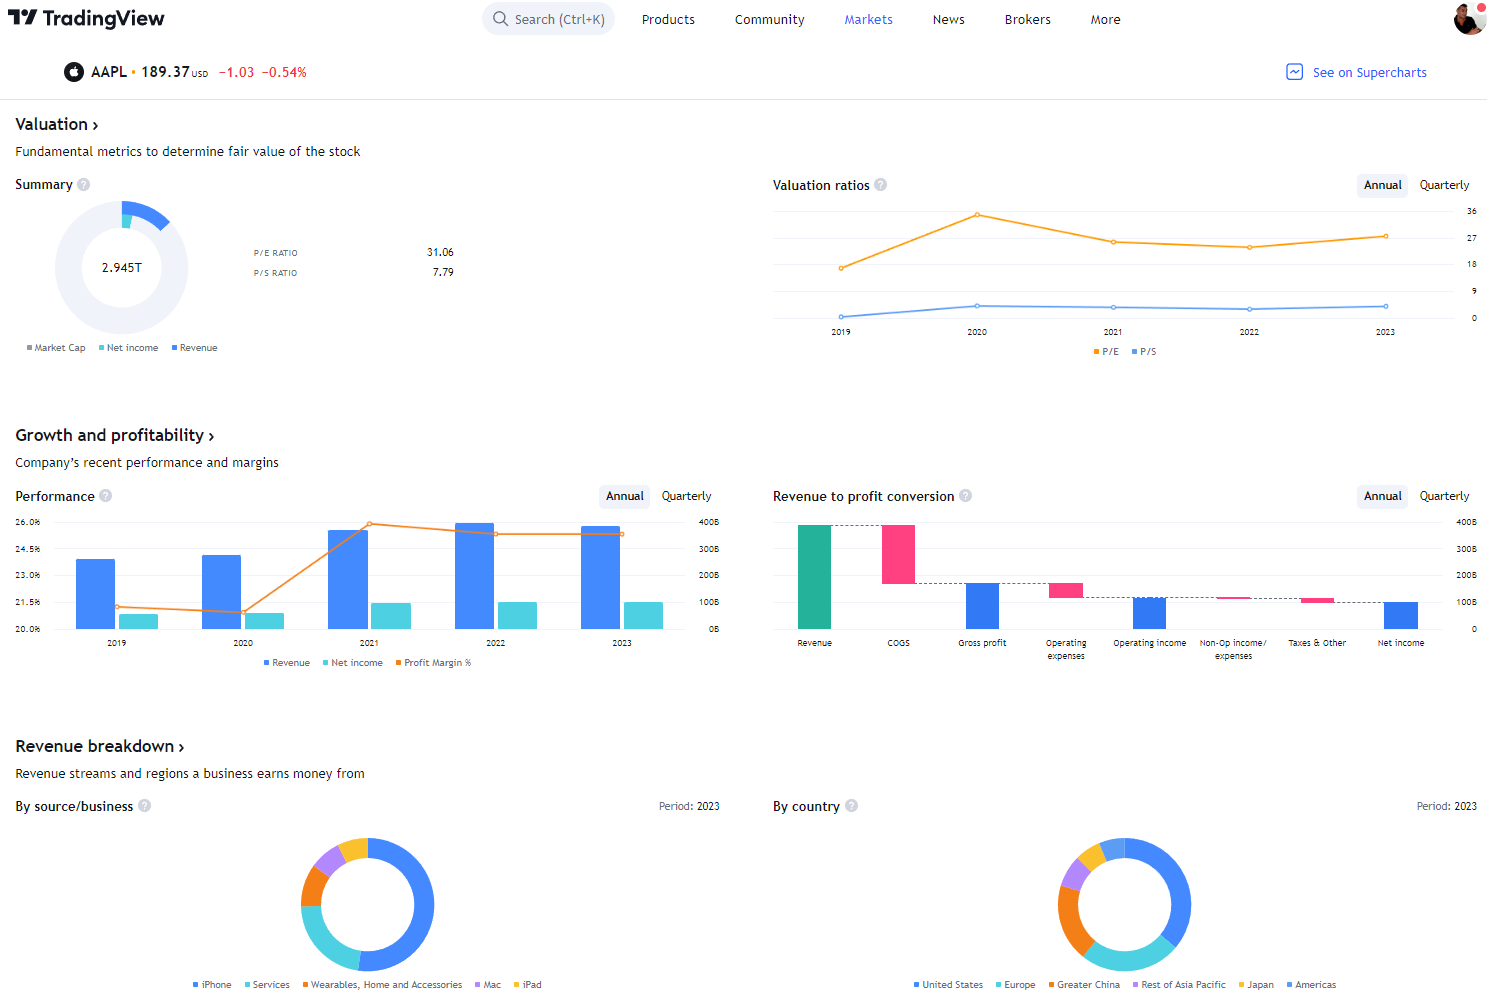
Searching for Investments
The TradingView stock screener has 160 different criteria. You can examine common ones like EPS, Quick Ratio, and PE Rati or examine unique ones like the number of employees and enterprise value.
You can change the columns and filters to fit your needs. For example, I adjusted my view to show the number of employees, P/E, and EPS TTM.

Strategy Tester
I find TradingView’s strategy tester to be incredibly user-friendly and flexible for advanced strategy testing. Though a couple of hurdles exist, such as needing to learn Pine Script to code strategies and the inability to test on a group of stocks, it still offers some fantastic features.
One of the standout features is the active community. Many folks develop and sell stock analysis systems. If you’ve got a premium subscription, you can even create and sell your own systems. The community offers a range of indicators and systems, many of which are free.
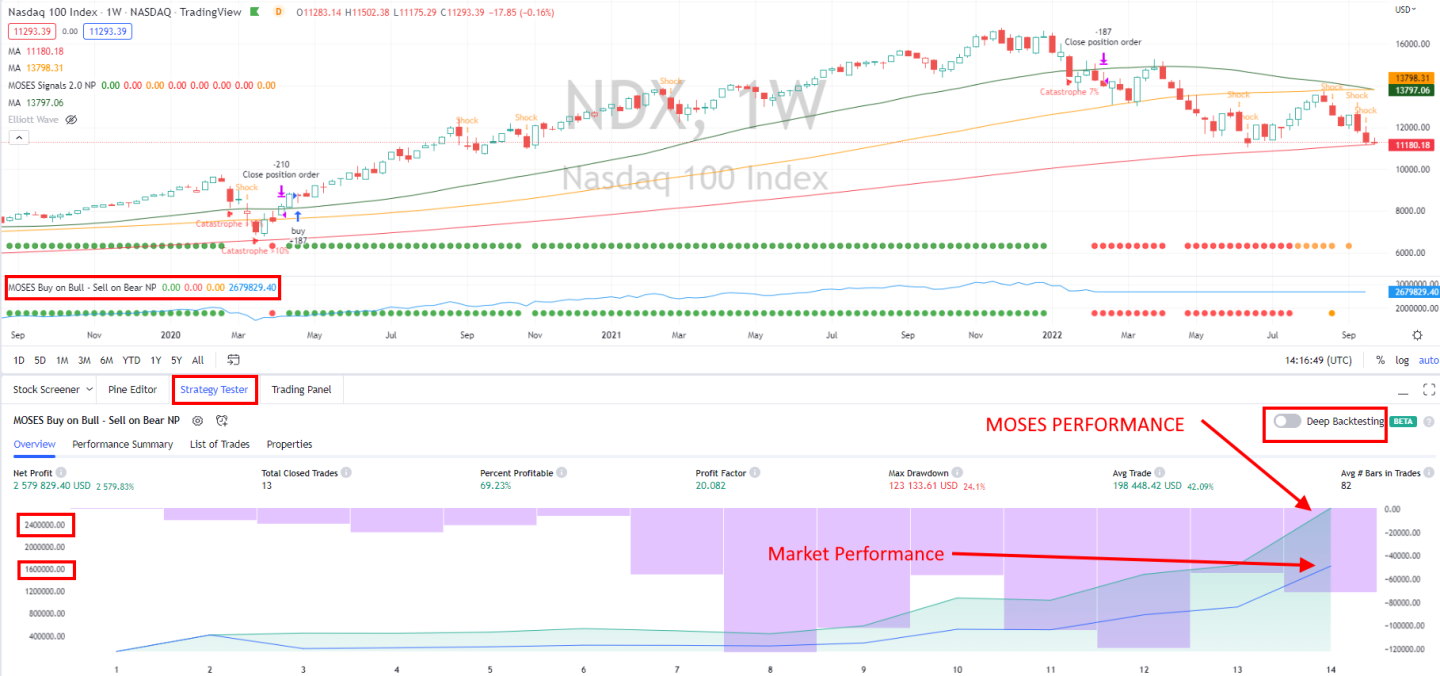
When it comes to backtesting, TradingView effectively simplifies the process. For instance, I used an in-built strategy called “Slow Stochastics.” This strategy initiates a trade when indicators show that stocks are oversold and sells when they are overbought. You only need a few clicks to get results: head to the strategy tester and add your chosen strategy.
Here are some key metrics provided by TradingView’s backtesting:
- Net Profit
- Drawdown
- Buy-and-Hold Return
- Percentage of Profitable Trades
- Number of Trades
I’ve even added my own MOSES ETF Trading strategy in TradingView. Despite not being a developer, Pine Script’s natural language made it relatively easy for me.
Another feature I find valuable is the market replay functionality. This lets you go back in time, replay the market activity, and show trades executed on the chart. All buy and sell orders are clearly drawn and highlighted on the chart.
Chart Pattern Recognition
TradingView provides automated candlestick recognition for 48 patterns at no extra cost. This feature works globally with stocks, ETFs, Forex, and cryptocurrencies.
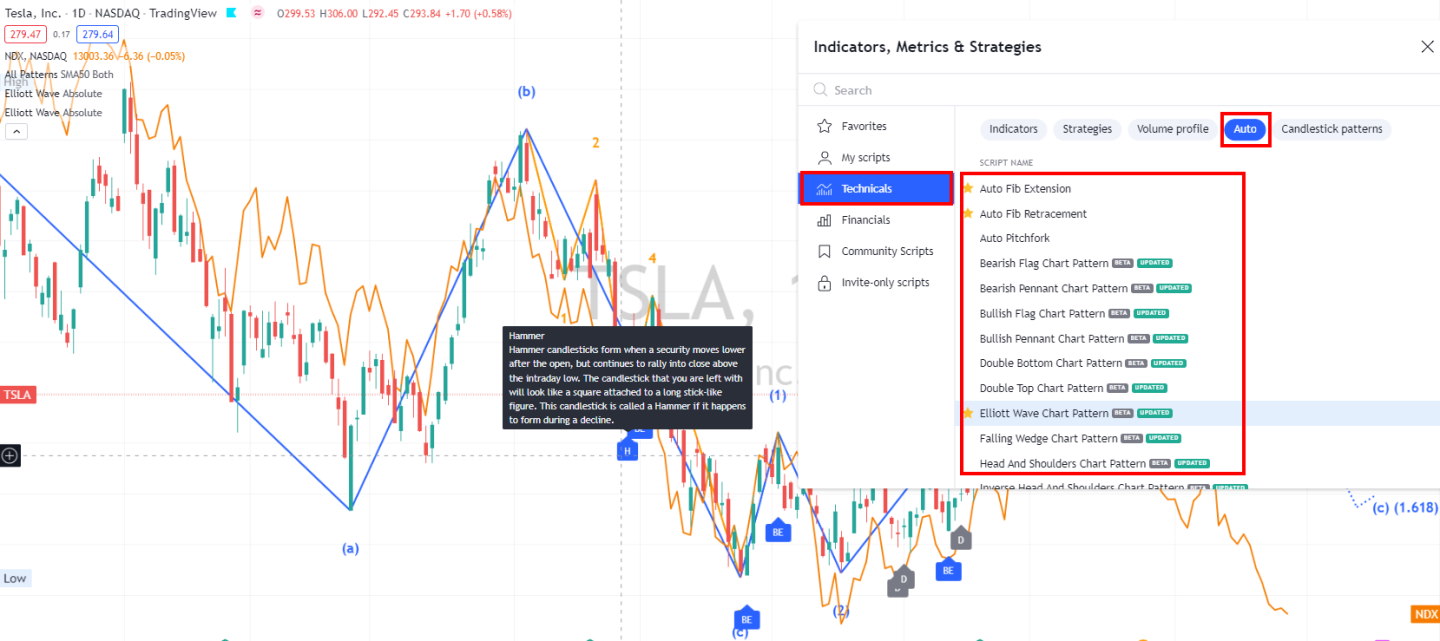
One thing I enjoy is the mouse-hover feature, which gives a detailed explanation of each pattern.
I’ve found that recognizing chart patterns can be really helpful. TradingView can identify 16 high-probability patterns, such as double tops, bottoms, flags, wedges, and triangles. These patterns can give us clues about possible future price movements.
News & Social
TradingView is home to a community of over 20 million traders. It’s an amazing space to connect with others, discuss your ideas, and discover new trading strategies. I enjoy using the chat feature to learn from other traders and share my own insights.
TradingView integrates news feeds from Benzinga, Reuters, and MT Newswire. This means that you can stay updated with the latest market news directly on the platform. The real-time news service is pretty impressive, closely ranking behind Benzinga Pro and MetaStock R/T.
Let’s take a look at how TradingView compares with other platforms in terms of news and community:
| Platform | News Rank | Realtime News | News Scanning | Community |
|---|---|---|---|---|
| TradingView | #1 | ❌ | ❌ | ✅ |
| MetaStock R/T | #2 | ✅ | ✅ | ❌ |
| TrendSpider | #3 | ❌ | ✅ | ❌ |
TradingView excels in providing a strong community, making it easy to share and discuss ideas.
Mobile App
TradingView’s mobile app is impressive, with a 4.9/5 star rating on the Apple App Store and 4.8/5 on Google Play. The app is designed with simplicity in mind, making it easy to use.
Is TradingView Trustworthy?
TradingView has reliable trading software and vigilant moderators for community content. After six years as a customer and partner, I find the service to be extremely dependable.
Is TradingView Worth It?
I believe TradingView is worth it. It’s a great tool with powerful charts, various indicators, and backtesting features. Plus, 20 million users use it every month, which shows just how popular it is.
Why TradingView Pro is Worth It!
TradingView Pro is amazing for a few reasons. It has technical stock ratings and global broker integration for easy trading. The screening with built-in pattern recognition is top-notch. My favorite part is the global community, where traders share custom indicators and trading ideas.
Summary
I explored TradingView’s platform with its charting, screening, and backtesting tools. It offers access to Stocks, Forex, Crypto, and Bonds on many different exchanges. With a lively social community, it truly feels like a global hub for traders. A good free screening alternative is Finviz, but it lacks TradingView’s global community and ease of use.
★ Discover our list of free stock analysis software to unleash your inspiration! ★
TradingView Review: Charts & Screening Tools Tested
As a long-time user and paid subscriber of TradingView, I find its features highly reliable for daily trading activities. With 20 million users and integrated live trading, it offers continuous trading inspiration.
Price: 0.00
Price Currency: USD
Operating System: Web, Windows
4.8
Pros
- 20 million users make it an ideal place to learn.
- You can trade directly from charts.
- Excellent screening and chart analysis.
- Supports all global stock exchanges.
- Over 100,000 user-generated strategies.
- Affordable.
- User-friendly and easy to set up.
Cons
- Not suitable for value or dividend investors.
- Lacks features for stock options.