I want to talk about CANSLIM, a stock-picking method that’s gotten a lot of buzz. It’s a way to find stocks that could potentially grow fast and outperform the market. William O’Neil, who started Investor’s Business Daily, came up with this idea. He looked at what made some stocks do really well and turned it into a system.
The goal is to spot stocks that could take off soon. Some people say it works great, but it’s hard to know for sure how well it does over time.
Understanding CANSLIM
CANSLIM is a stock-picking strategy I find fascinating. It mixes fundamental and technical analysis. The letters stand for key factors:
C – Current earnings
A – Annual earnings growth
N – New products or management
S – Supply and demand
L – Leader in its industry
I – Institutional sponsorship
M – Market direction
This approach aims to beat the market, focusing on strong companies in uptrends.
Is CANSLIM Profitable?
Three academic studies suggest that the CAN SLIM strategy can be profitable and outperform the market. However, my real-world research shows that most CANSLIM or IBD-based mutual funds have failed or underperformed versus the market.
My findings on CANSLIM’s effectiveness have been somewhat inconsistent. While Investor’s Business Daily claims a 20.7% average annual return, they don’t provide audited evidence to back this up. In my research, the Stock Rover “CAN SLIM (Less Restrictive)” screener has shown some promise.
However, CANSLIM-based funds like CANGX and the Innovator IDB 50 ETF have underperformed in the market. It’s worth noting that older CANSLIM portfolios and academic studies are now outdated and may not reflect current market conditions.
During downtrends, CANSLIM’s focus on growth stocks can be risky. Investors should be cautious and adapt their strategy to changing market conditions.
CANSLIM Criteria
C – Current Earnings
Current earnings are a crucial factor in identifying promising growth stocks. Companies with strong recent quarterly earnings, ideally 18-20% higher than the previous year, tend to show great potential. It’s also important to look for sales growth of at least 25%. Without solid sales, earnings growth becomes unsustainable.
Here’s a quick breakdown of what to look for:
- Quarterly earnings growth: 18-20% or higher
- Sales growth: 25% or more
These numbers indicate a company’s financial health and growth trajectory. By focusing on current earnings, I can spot companies that are performing well right now, not just those with past success.
A – Annual Earnings
Annual earnings give me a broader view of a company’s financial performance. I look for businesses with a consistent track record of earnings growth over several years. A good benchmark is an annual growth rate of at least 25%.
Another key metric I consider is Return on Equity (ROE). An ROE above 17% suggests the company is using its capital efficiently. This efficiency often translates to better long-term performance.
When screening stocks, I typically use these criteria:
- 5-year annual earnings growth rate: 25% or higher
- Return on Equity (ROE): Above 17%
Using a longer timeframe helps me avoid companies that might be manipulating short-term results or experiencing temporary growth spurts.
N – New Products, Management, or Price Highs
Innovation is a key driver of growth in many industries. I pay close attention to companies that are consistently introducing new products or services. These innovations can give a company a competitive edge and fuel future growth.
Changes in management can also be significant. New leadership often brings fresh ideas and strategies. However, I’m cautious about companies that frequently change their top executives. Constant turnover can be a red flag.
Stock price highs can be another positive indicator. When a stock reaches new highs, it often attracts more attention and demand, potentially driving the price even higher.
Key things I look for:
- Regular product or service innovations
- Positive management changes (but not too frequent)
- Stocks reaching new price highs
S – Supply and Demand
The balance of supply and demand is fundamental to stock price movements. I pay close attention to trading volume as an indicator of demand. Rising prices coupled with increasing volume often signal strong demand for a stock.
I typically look for daily trading volumes that exceed the stock’s three-month average. This increased activity can suggest growing investor interest.
Here’s what I watch for:
- Increasing stock price over weeks or months
- Rising trading volume
- Daily volume higher than the three-month average
Together, these factors can indicate a stock with momentum and potential for further gains.
L – Leaders
I focus on companies that are leaders in their industries. These businesses often have strong competitive advantages, whether in product quality, service, or pricing.
One way I identify leaders is by examining their stock performance relative to competitors and the broader market. Companies whose stocks outperform 80% or more of the market are often industry leaders.
I look for:
- Stocks near or at their 52-week highs
- Companies outperforming major market indices
- Relative strength compared to industry peers
By selecting stocks that are already beating the market, I aim to increase my chances of continued outperformance.
I – Institutional Ownership
Institutional investors, like mutual funds and pension funds, can significantly impact stock prices. Their large-scale buying power can drive prices up, while their selling can push prices down.
I look for stocks with substantial institutional ownership, but not too much.
Here’s my ideal range:
- Minimum institutional ownership: 30%
- Maximum institutional ownership: 90%
Stocks with less than 30% institutional ownership might not be on the radar of big investors yet. On the other hand, if institutional ownership exceeds 90%, there might be limited room for further price increases.
M – Market Direction
Understanding the overall market direction is crucial for timing stock purchases. The market can move in three directions: uptrend, downtrend, or sideways (consolidation).
I prefer to buy stocks during uptrends or bull markets. This strategy aligns with the fact that most stocks tend to move in the same direction as the overall market.
Key points I consider:
- Current market trend (uptrend, downtrend, or consolidation)
- Performance of major market indices
- Sector and industry trends
By investing in the market trend, I aim to increase my chances of profitability. Buying stocks during a bull market typically offers better odds of success than trying to pick winners in a bear market.
The CANSLIM Strategy
Adaptability
CANSLIM is a versatile investing approach. It doesn’t lock you into a fixed holding period—you might keep a stock for days or years. This flexibility lets me adapt to market changes quickly. Depending on how the stock performs, I can use it for short-term trades or longer holds. But it’s not for value hunters—CANSLIM is all about growth and momentum.
Momentum
CANSLIM thrives on momentum. I look for stocks hitting new 52-week highs with increased trading volume. The broader market should be trending up, too. It’s a classic momentum play – riding the wave of positive sentiment and price action. Timing is key here. I aim to catch stocks just as they’re starting their upward climb.
Profitable Growth
Strong earnings growth is crucial in CANSLIM. I zero in on companies with impressive quarterly and annual earnings increases. Sales should be climbing, too. This focus on profitable growth helps me find businesses that are expanding, not just sustainably.
Exceptional Products
The ‘L’ in CANSLIM stands for leaders.
I seek out companies leading their industries in:
- Product innovation
- Service quality
- Stock price growth
These leaders often have:
- Strong brand recognition
- Competitive advantages
- Solid market share
I also consider good corporate governance and ethical practices as part of leadership.
Growing Markets
A booming market can lift even average companies. That’s why the ‘M’ in CANSLIM matters so much to me. I look for businesses operating in expanding sectors.
Some examples:
- Tech companies during the Internet boom
- Chip makers riding the crypto mining wave
- Electric vehicle manufacturers in today’s green energy push
Growing markets provide tailwinds that can supercharge a company’s growth potential.
In essence, CANSLIM helps me identify profitable companies with stellar products in expanding markets – and buy them at the right moment. It’s a strategy that combines fundamental strength with perfect timing.
Academic Research on CANSLIM
The CAN SLIM investment strategy combines fundamental and technical analysis to identify growth stocks with strong potential. Several academic studies have evaluated its effectiveness:
- “Outperforming the Broad Market: An Application of CAN SLIM Strategy”: This study applied a simplified CAN SLIM model to the NASDAQ 100, focusing on three criteria: a five-year average annual earnings growth over 20%, current quarterly earnings growth over 25%, and a stock price above $10. The findings indicated that this approach could outperform market benchmarks, suggesting the strategy’s potential effectiveness. researchgate.net
- “Towards a Simplified CAN SLIM Model”: Researchers compared four stock-picking models—Buffett, Graham, Greenblatt, and O’Neil’s CAN SLIM—and found that CAN SLIM consistently outperformed the S&P 500. To make the strategy more accessible, they proposed a simplified version focusing on key components like earnings and price, which also demonstrated superior performance (0.18% pa) relative to the market index. researchgate.net
- “Live Out of Sample Testing of CAN SLIM Stock Selection Strategy”: This paper conducted a live paper-trading test of the CAN SLIM system from July 2014 to February 2017. The portfolio, selected based on O’Neil’s methodology, outperformed the S&P 500 by 20%, the NASDAQ by 9%, and the Dow Jones by 17% during the holding period. articlegateway.com
These studies suggest that the CAN SLIM strategy can be effective in identifying high-performing stocks and potentially outperforming market benchmarks. Simplified versions of the model have also shown promising results, making the strategy more accessible to individual investors.
I came across an interesting academic study on CANSLIM from 2013. It showed that the strategy beat the NASDAQ 100 Index by 0.94% per month from 1999 to 2013. The researchers also said CANSLIM had better risk-adjusted returns.
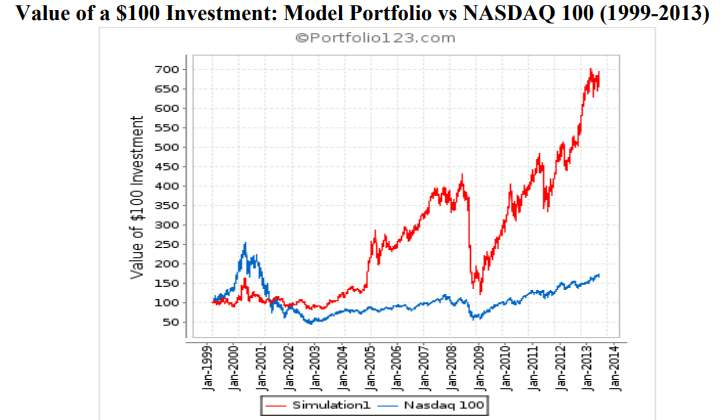
This chart compares CANSLIM to the NASDAQ 100. The blue line shows CANSLIM doing better over time.
CANSLIM Select Growth Fund (Failed)
The CANSLIM Select Growth Fund (CANGX) started in 2005. It tried to use the CANSLIM method in an ETF. Sadly, it didn’t do as well as hoped and has since been closed.
I checked the numbers. On average, CANGX fell behind the S&P 500 by 0.79% each year. That’s not great for a fund that was supposed to beat the market.

This chart shows how CANGX (the red line) did worse than the S&P 500 (the blue line) over time.
IBD 50 ETF 10-Year Performance +18%
I’ve looked into the performance of the CANSLIM Innovator IBD 50 ETF (FFTY). This fund, which follows the CANSLIM strategy, hasn’t kept up with the market since it started in 2015. From 2015 to 2025, FFTY gains only 18%. At the same time, the S&P 500 gained 242%, and the Nasdaq 100 soared 247%.
The chart below shows FFTY’s performance from April 2015 to 2025:

S&P 500 10-Year Performance +242%
In the seven years to 2022, FFTY returned 42%. The S&P 500 ETF did much better at 109%, while the Nasdaq 100 shot up 216%. The chart shows FFTY rarely beat the S&P 500 during this time.
CANSLIM Tactical Growth Fund (Failed)
I have some bad news about this fund. It closed down in July 2021 because not enough people wanted to invest in it.
The fund managers said it wasn’t making enough money to keep going, and they didn’t think it would grow much in the future, either. So, they decided to shut it down on August 31, 2021.
This shows that even good ideas on paper can struggle in the real world. CANSLIM looks for top stocks in bull markets. But it seems the fund had trouble finding enough winners.
I think this teaches us a few things:
- Past results don’t always predict future success
- It’s hard to beat the market over long periods
- Even smart strategies can fail if not enough people use them
Performance of the AAII CANSLIM Portfolio
I’ve looked into the AAII CANSLIM model portfolios, and the results are concerning. In 2022, these portfolios took a big hit, losing an average of 25%. This poor performance raises questions about the effectiveness of the CANSLIM approach in today’s market.
One major issue I found is the small number of stocks in each portfolio. The “O’Neil’s CAN SLIM Revised 3rd Edition Screen” has just one stock, and the “O’Neil’s CAN SLIM No Float Screen” and “O’Neil’s CAN SLIM Screen” each contain only three stocks. With so few stocks, these portfolios lack diversity and are very risky.
This limited selection suggests that the CANSLIM criteria might be too strict for the current stock market. Not enough stocks may meet these tough standards. Another explanation could be that AAII’s interpretation of CANSLIM is too narrow.
The Dow Jones Industrial Average, a key market index, isn’t directly linked to these CANSLIM portfolios. But it’s worth noting that the Dow’s performance can give us a sense of how the broader market is doing compared to these specialized portfolios.
I can’t rely on the AAII CANSLIM portfolios to test how well this investing system works. The tiny number of stocks and the big losses in 2022 make these portfolios unreliable for judging CANSLIM’s true potential.
Creating an Effective CANSLIM Stock Screener
I use a stock screener to find CANSLIM stocks efficiently. It scans the market for companies meeting specific criteria, helping me identify potential winners quickly.
Here’s what I look for:
- Current earnings growth
- Annual earnings growth
- New products or management
- Supply and demand
- Leader in industry
- Institutional sponsorship
CANSLIM Stock Screening Tool
A good CANSLIM stock screener is crucial for finding stocks that fit this strategy. I look for tools that can scan for earnings growth over 5 years and filter stocks near 52-week highs. The screener should also check the number of outstanding shares and compare a stock’s price strength to competitors. Tracking institutional ownership is another key feature.
To put CANSLIM into action, I need a screener that can quickly search the whole market for stocks meeting these criteria. For U.S. and Canadian stocks, Stock Rover is an excellent choice. It won top marks in a review of the 10 best stock screeners and offers great value. For international stocks, TradingView is a solid option.
With these tools, I can efficiently identify potential CANSLIM candidates without manually sifting through endless stock data. This saves me time and helps ensure I don’t miss promising opportunities.
Stock Rover – The Smart Choice for Savvy Long-term Investors
As an investor, I’ve always wanted powerful insights without the complexity. Stock Rover changed the game for me. With its deep screening tools and hundreds of metrics, I can quickly find stocks and ETFs that match my strategy. It streamlined my research and made decision-making so much easier.
Comparing investments used to be a hassle—now it’s a breeze. Stock Rover lets me analyze multiple stocks, ETFs, or portfolios side by side. I get clear views on fair value, quality, and growth potential, helping me make smarter, more confident choices.
Tracking my portfolio is now seamless. By linking my brokerage, I get real-time updates and detailed analytics. Features like dividend forecasts and rebalancing tools help me stay on track and plan effectively for the long term.
Stock Rover is the only service I recommended for growth, dividend, and value investors.
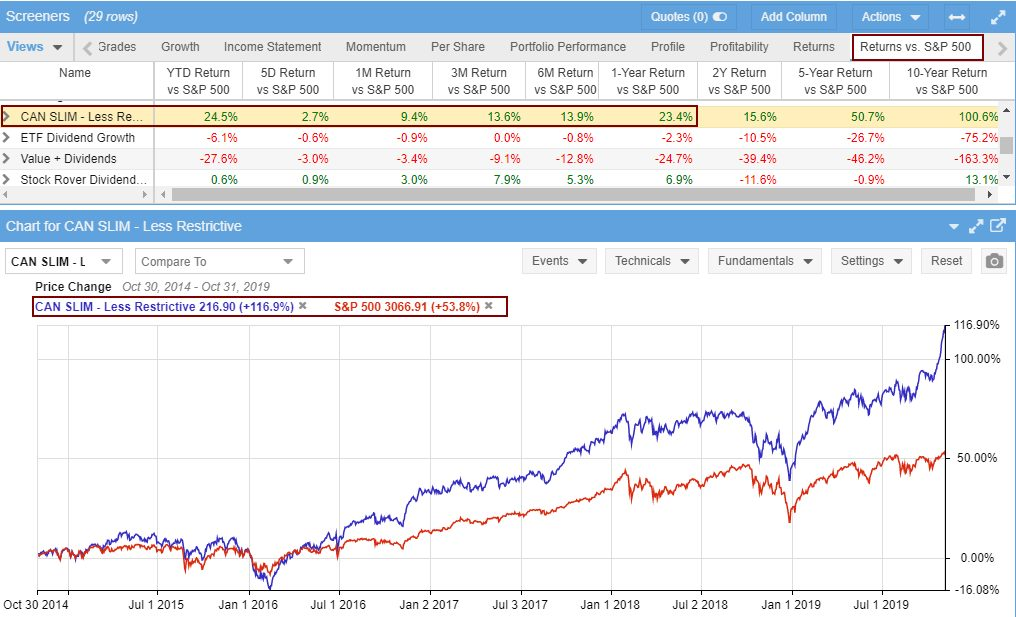
The CANSLIM Screener by Stock Rover
The Stock Rover CANSLIM screener is a useful tool for beating the market. It outperforms the S&P 500 across all timeframes, from 5 days to 10 years.
The results are clear in this image:
Get the CANSLIM Method Screener on Stock Rover
Performance of the Stock Rover CANSLIM Portfolio
The CANSLIM strategy screener in Stock Rover delivers impressive results. Over the past year, it achieved a 48.1% profit, beating the S&P 500’s 10.5%. The long-term performance is even more striking. In the last 5 years, the CANSLIM portfolio gained 176%, while the S&P 500 rose 68.3%.
Here’s a quick comparison:
| Time Frame | Stock Rover CANSLIM | S&P 500 |
|---|---|---|
| 1-Year | +48.1% | +10.5% |
| 5-Year | +176% | +68.3% |
These numbers show how the CANSLIM approach can outperform the market. Stock Rover’s tool makes it easy to apply this growth strategy to my investing.
Effectively Apply CANSLIM in Stock Rover in 5 Steps
1 – Register with Stock Rover
I recommend getting a Premium Plus Membership with Stock Rover. This gives access to all the criteria and a 10-year database history. It also unlocks Warren Buffett screeners, dividend strategies, and more investing tools.
Stock Rover stands out for:
- Growth investing with research reports
- Value investing using Buffett’s methods
- Income investing to find steady dividend stocks
For a detailed analysis of Stock Rover, be sure to check out my StockRover review.
After 20 years of investing, I now manage all my stock picks with Stock Rover. It simplifies the complex process of stock analysis.
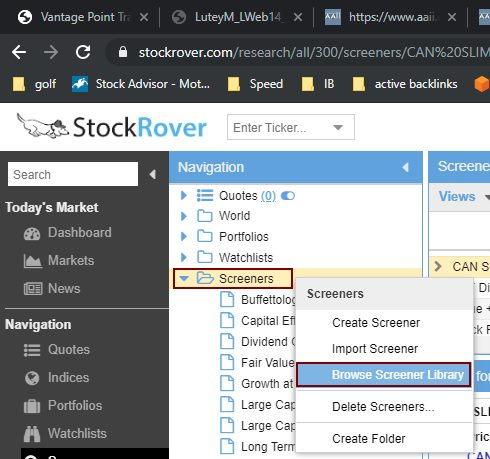
2 – Browse Screener Library
To get started:
- Launch Stock Rover
- Click Screeners (Down Arrow)
- Select Browse Screener Library
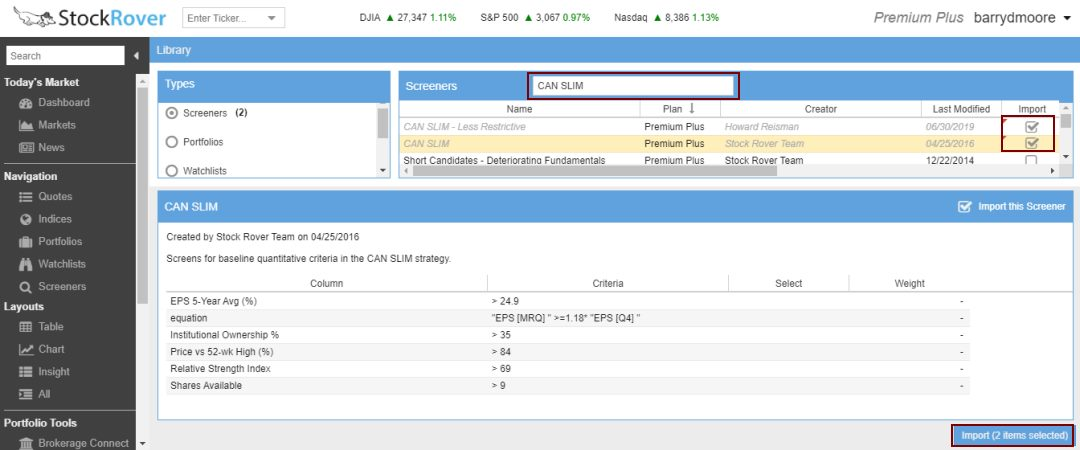
3 – Import CANSLIM Screeners
Stock Rover has a built-in CANSLIM screener called “CAN SLIM—Less Restrictive.”
Here’s how to import it:
- Type “CAN SLIM” in the Screeners search box
- Choose the CANSLIM (Less Restrictive) screener
- Click “Import”
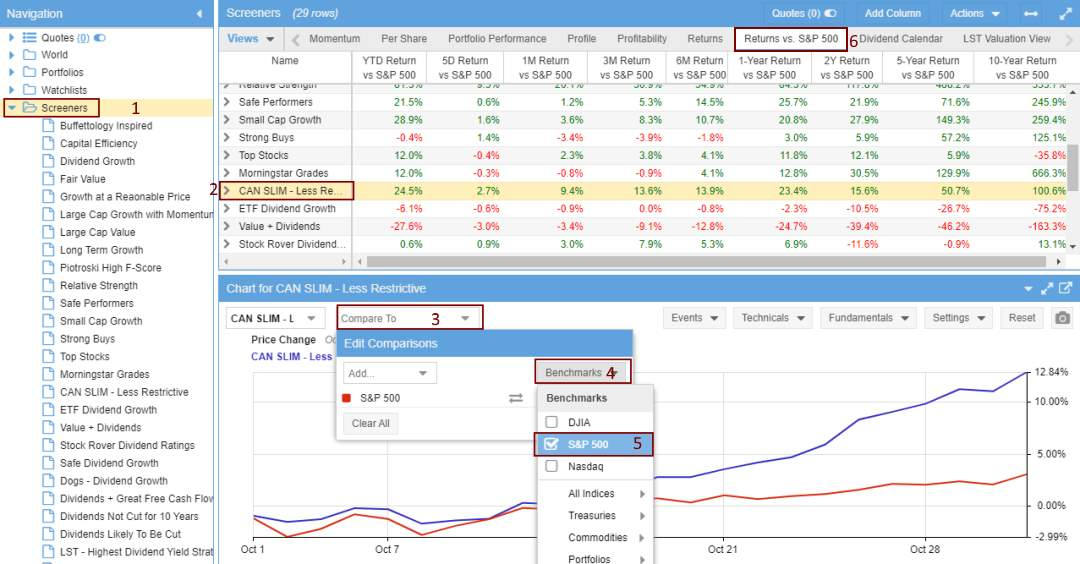
4 – View the Portfolio Performance
To compare the screener results to the S&P 500:
- Select Screeners
- Pick the CAN SLIM – Less Restrictive Screener
- In the chart below, click “Compare To”
- Choose Benchmarks
- Select S&P 500 or NASDAQ
- Add the Return Vs. S&P 500 column view
5 – Select Your CANSLIM Stocks
The scan typically yields about 32 stocks from over 12,000 companies. This is still a lot to manage, so I suggest narrowing it down further.
One approach I use is combining CANSLIM with Warren Buffett’s margin of safety concept. This helps identify undervalued stocks among the CANSLIM picks.
To do this:
- Run the CANSLIM screener
- Apply a margin of safety filter
- Select the top 10 stocks with the highest margin of safety
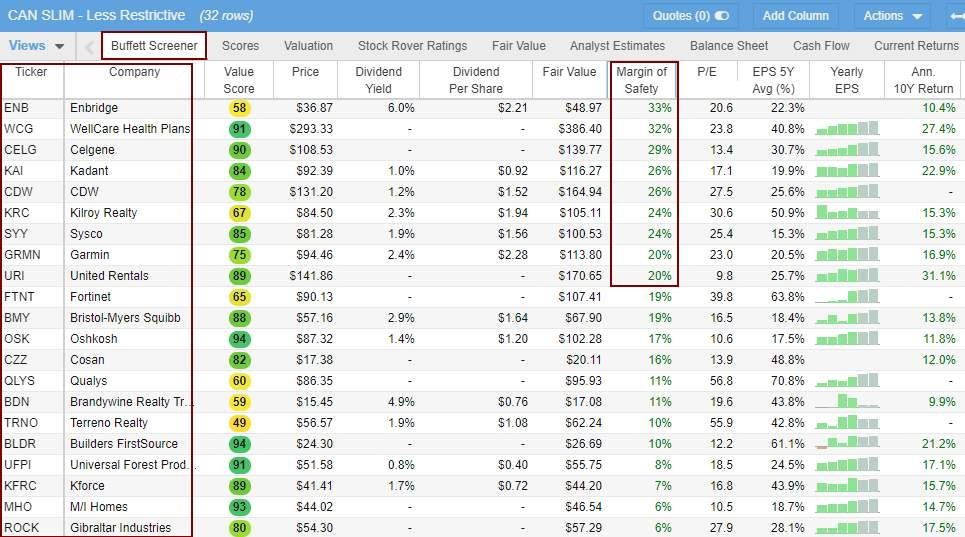
This method balances growth potential with value investing principles. It’s effective for identifying promising stocks while managing risk.
FAQ
How does CANSLIM work?
CANSLIM zeros in on stocks with solid fundamentals. I look for positive earnings, steady growth, and backing from big investors. The goal is to spot companies that show signs of great performance before they take off.
How effective is the CANSLIM investing strategy?
My research shows poor. ETFs based on CANSLIM have lagged the market over the past 10 years. However, using looser CANSLIM criteria in custom stock screens can work quite well. It’s not perfect, but it can be useful if applied thoughtfully.
What type of stocks does CANSLIM focus on?
I use CANSLIM to find fast-growing companies. I look for earnings growth over 20% and exciting new products. Big institutional ownership is another key sign. These are often smaller, innovative firms with lots of upside potential.
Does CANSLIM work in bear markets?
CANSLIM isn’t great in down markets. It’s built to find winners when stocks are rising. In bear markets, the growth factors it relies on don’t work as well. I’d be cautious using it when the overall market is falling.
How can I implement the CANSLIM investing strategy?
To use CANSLIM, start by screening stocks on the seven key factors. Stock Rover has a pre-made “CANSLIM (Less Restrictive)” screen that’s shown good results in testing.
From there, dig deeper into the most promising candidates before investing.