Investors looking to find promising opportunities in the stock market need stock screening tools. I’ve spent years using both Stock Rover and Finviz, two popular platforms that help analyze and filter stocks based on fundamental and technical criteria.
Stock Rover excels at financial screening and portfolio management, while Finviz is better at pattern recognition and technical screening.
In my experience, they cater to different types of investors and trading styles. Comparing their features, ease of use, and data quality can help determine which platform might be a better fit for individual needs and preferences.
Stock Rover vs. Finviz Ratings
I’ve compared Stock Rover and Finviz, focusing on their stock rating features. My Stock Rover review shows it shines with its extensive screening options, letting me filter stocks using over 650 metrics, including financial ratios, valuation measures, and growth rates. This depth of analysis is impressive and helps me make well-informed investment decisions.
Finviz, on the other hand, catches my eye with its user-friendly interface and visual data presentation. Its stock screener offers more than 60 filters, which is solid but not as comprehensive as Stock Rover’s. I can easily screen for stocks based on market cap, sector, and industry.
Here’s a quick comparison of their ratings:
| Feature | Stock Rover | Finviz |
|---|---|---|
| Overall Rating | 4.5/5 | 4.1/5 |
| Pricing | ★★★★★ | ★★★★☆ |
| Software | ★★★★★ | ★★★★☆ |
| Trading | ★★★☆☆ | ★★★☆☆ |
| Screening | ★★★★★ | ★★★★☆ |
| Portfolio Management | ★★★★★ | ★★☆☆☆ |
| Pattern Recognition | ★☆☆☆☆ | ★★★★☆ |
| News | ★★★☆☆ | ★★★☆☆ |
| Chart Analysis | ★★★★☆ | ★★★★☆ |
| Backtesting | ★★★★☆ | ★★★★☆ |
| Usability | ★★★★★ | ★★★★☆ |
Stock Rover stands out for its stock research and portfolio management tools. I find its screening capabilities top-notch, making it easier to spot potential investments. Finviz excels in pattern recognition and heat maps, which are great for visual traders.
Both platforms offer analyst ratings, but Stock Rover’s integration of these ratings with its other tools gives it an edge. I can easily compare analyst opinions with my research, all in one place.
In terms of pricing, Stock Rover offers more value for serious investors. Finviz has a free version with basic features, which is nice for beginners or casual users. However, for in-depth analysis, I lean towards Stock Rover’s paid plans.
Verdict
I prefer Stock Rover over Finviz for its top-notch screener and broker integration. Stock Rover’s research reports and backtesting tools are impressive. Finviz lags in user experience and stock charts but shines in data visualization. Here’s a quick comparison:
| Feature | Stock Rover | Finviz |
|---|---|---|
| Screener | ⭐⭐⭐⭐⭐ | ⭐⭐⭐ |
| Broker Integration | ✅ | ❌ |
| Research Reports | ✅ | ❌ |
| Backtesting | ⭐⭐⭐⭐⭐ | ⭐⭐ |
| Data Visualization | ⭐⭐⭐ | ⭐⭐⭐⭐⭐ |
| User Experience | ⭐⭐⭐⭐ | ⭐⭐ |
| Stock Charts | ⭐⭐⭐⭐ | ⭐⭐⭐ |
Features Comparison
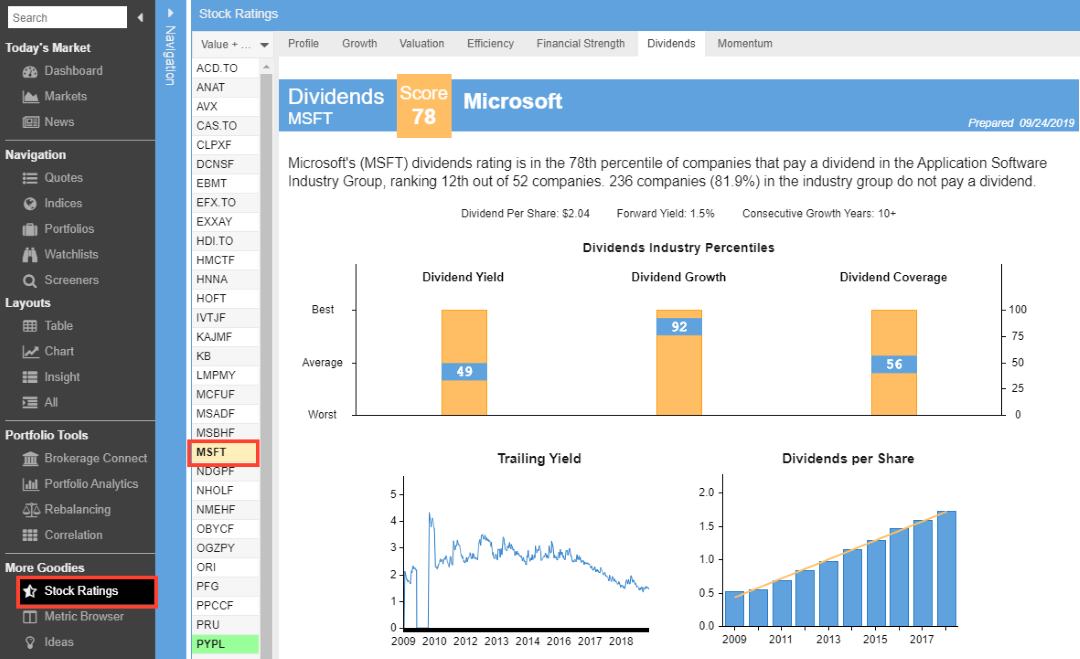
Stock Rover and Finviz offer distinct features for investors. Stock Rover stands out with its screening, watchlists, and portfolio tools. It’s great for those focused on dividends, growth, and value investing. It provides backtesting and a 10-year fundamental history.
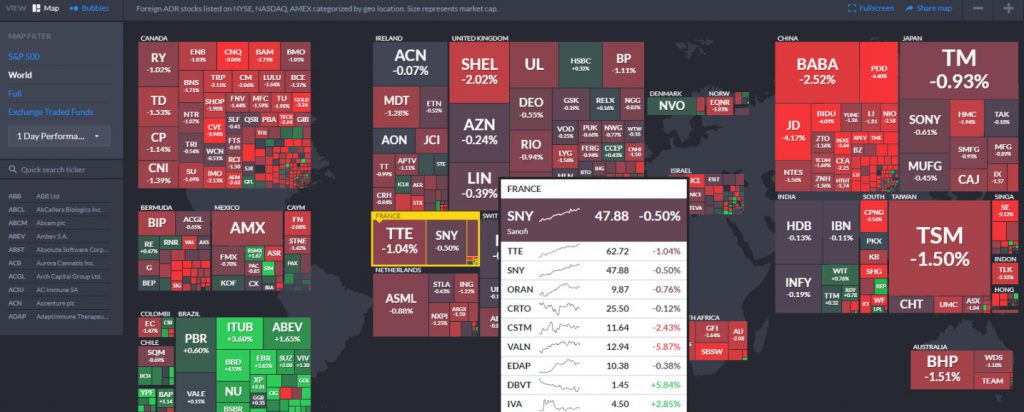
Finviz, on the other hand, caters to both investors and traders. Its screening tools are coupled with heatmaps, which I find visually helpful. The platform also offers pattern recognition and trading signals, which can be useful for technical analysis.
Both platforms are web-based and cover US stocks and ETFs. They offer free plans, which is a plus for beginners. For more advanced features, paid subscriptions are available monthly or yearly.
Here’s a quick comparison:
| Feature | Stock Rover | Finviz |
|---|---|---|
| Core Features | Screening, Watchlists, Portfolios | Screening, Heatmaps |
| Special Features | Backtesting, 10-Year History | Patterns, Signals |
| Best For | US Stock & ETF Investors | Beginner Investors/Traders |
| Free Plan | Yes | Yes |
| Paid Plans | From $23/month (annual) | From $25/month (annual) |
Pricing Compared
Stock Rover Discounts
Here is a great way to save money on Stock Rover plans. Sign up for a free 14-day trial of their Premium or Premium Plus service to snag a 25% discount on any premium plan. Just wait until the end of the trial period, and you’ll get an email with this special offer. It’s a smart way to test out the full features and then lock in savings.
Stock Rover’s pricing is tiered:
- Free plan: $0
- Essentials: $7.99/month
- Premium: $17.99/month
- Premium Plus: $27.99/month
Pro tip: Opt for a 2-year plan to get an extra 26% off. It’s the best value if you’re serious about using the tool long-term.
Finviz Discount
New customers can get a hefty 37% discount on the Elite subscription by choosing the annual plan. Instead of paying $39.99 monthly, you’ll only pay $24.96 per month when billed yearly. This is a significant saving for access to Finviz’s advanced features.
Finviz also has a solid free plan that’s worth checking out before committing to the paid version. It’s a good way to get familiar with their platform and decide if the upgrade is right for you.
Platforms
Stock Rover offers a more complete toolkit, letting me screen stocks, research companies, and build different types of portfolios all in one place. Its user-friendly interface makes it easy to use these tools together.
Finviz is great for stock screening and viewing market trends through heat maps. But its tools don’t integrate as smoothly as Stock Rover’s.
Both platforms are cloud-based, so I can access them on any device without installing software. They’re stable and easy to use.
Here’s a quick comparison of key features:
| Feature | Stock Rover | Finviz |
|---|---|---|
| Global Market Data | ❌ | ✅ |
| Stocks | ✅ | ✅ |
| ETFs | ✅ | ❌ |
| Screener | ✅ | ✅ |
| Backtesting | ✅ | ✅ |
| Automated Analysis | ✅ | ✅ |
Both platforms offer real-time data and stock prices from major exchanges.
Trading & Brokers
Stock Rover stands out for its focus on long-term investing strategies. I find its broker integration feature particularly useful. It connects with major brokers to provide comprehensive portfolio insights, including profit and loss reporting, correlation analysis, and rebalancing suggestions.
For income-focused investors like me, Stock Rover’s dividend reporting and scoring tools are invaluable. They help me build a portfolio that aims for a steady income and compound growth.
While it’s not designed for day trading, Stock Rover excels in supporting a safer, more secure investment approach. It emphasizes a margin of safety, which I believe is crucial for managing risk.

Screening
Stock Rover Screening & Scanning
Stock Rover is great for stock screening. It lets me quickly filter through 10,000 stocks and 44,000 ETFs. You can narrow down hundreds of stocks to just a few top picks that match your criteria.
The depth of data is impressive. With over 650 data points for stocks and 96 for ETFs, I can create very specific screens. One unique feature is comparing stocks to the S&P 500.
Here’s a quick breakdown of Stock Rover’s key screening features:
- 575+ screening options
- Ranked screening
- Relative performance screening
- No programming needed

Setting up a screen is simple. Create a new screener, name it, pick the stock type and size, and add criteria. It’s user-friendly and doesn’t require any coding skills.
Finviz Screening & Scanning
My Finviz review shows it is a solid choice for stock screening. It covers 8,500 major stocks from 60 countries. While it’s not as comprehensive as Stock Rover, it’s still a powerful tool.
I can filter stocks using 67 fundamental and technical criteria. What sets Finviz apart is its chart-based signals. I can screen for things like:
- New highs or lows
- Oversold conditions
- Analyst upgrades
- Insider buying
- Specific chart patterns
Finviz also uses pattern recognition. It can screen for:
- Ten major candlestick patterns
- 30 stock chart patterns
This mix of fundamental and technical screening makes Finviz great for both short-term traders and medium-term investors.
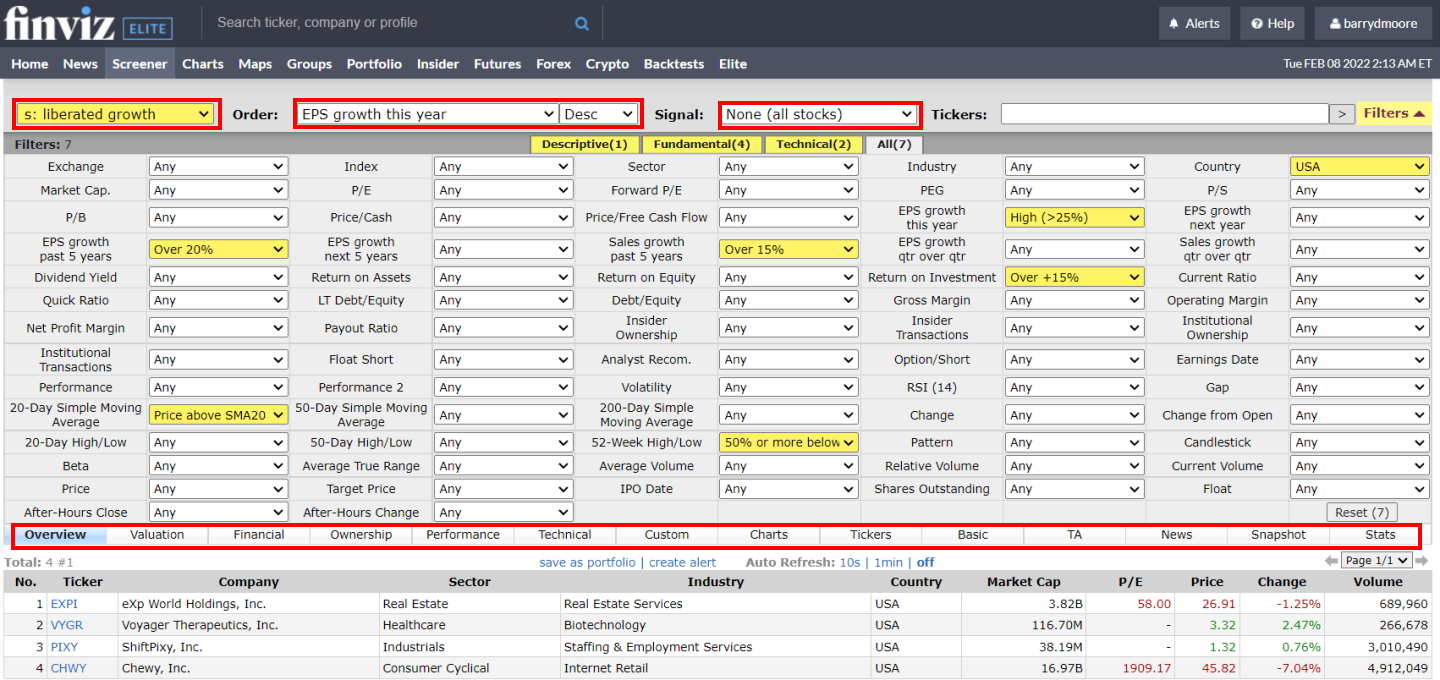
The Finviz screener is fast and easy to use. I can quickly filter stocks based on my chosen criteria and see the results in various formats, including charts and tables.
While both tools are strong contenders, I find Stock Rover’s deeper data set and ranked screening give it an edge for in-depth analysis. Finviz, on the other hand, is great for quick scans and technical pattern recognition.
Pattern & Trend Recognition
The Finviz automatic trendline detection is impressive. It spots price patterns like wedges, triangles, double tops, and channels on daily charts, which is a big plus for traders who rely on patterns. Finviz also offers 33 automated stock chart signals.
While Stock Rover lets you screen for 22 technical indicators, it doesn’t quite match up in true pattern recognition.
For those seeking top-notch AI-powered pattern recognition, I’d point to Trade Ideas, TrendSpider, and Tickeron. These platforms are leading the way in automated chart analysis, taking pattern recognition to the next level.
News & Social
Finviz and Stock Rover offer similar news streams, pulling from major outlets. Finviz stands out with its insider trading reports. These show when CEOs and execs buy or sell stocks and options. I think this data can be really useful for investors tracking market moves.
Chart Analysis
Stock Rover, The Master of Fundamental Charting
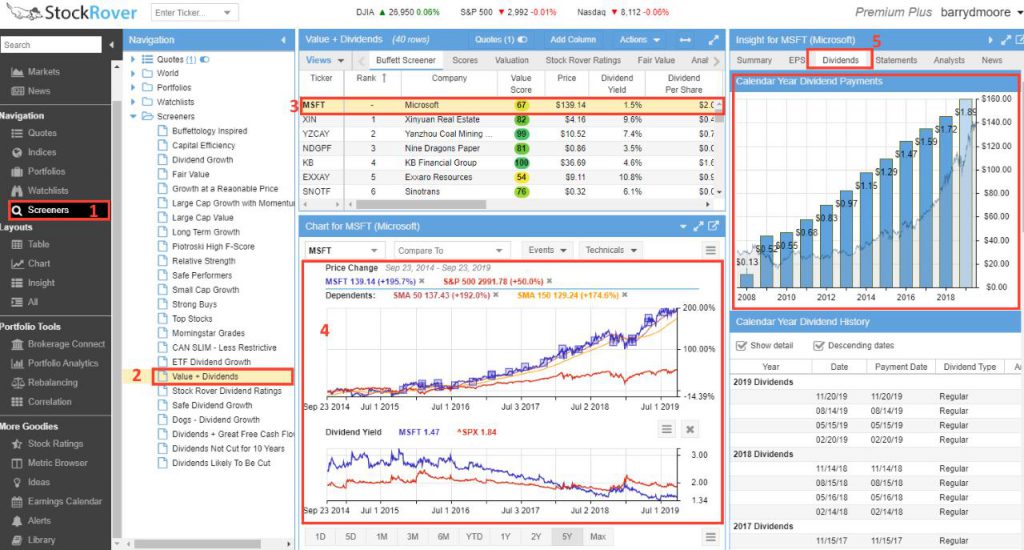
Stock Rover is a standout tool for fundamental charting. It offers over 240 financial indicators and 16 technical analysis tools, making it great for income, growth, and value investors. What sets it apart is its focus on charting fundamental financial strength indicators rather than just technical analysis.
You can easily visualize important metrics like:
- Dividend yield trends
- Earnings growth rates
- Debt-to-equity ratios
- Return on equity
This depth of fundamental data is perfect for long-term investors who want to examine a company’s financial health in depth. While it doesn’t currently allow for drawing trendlines or chart annotations, I’ve heard these features are coming soon.
Finviz Charting Is OK
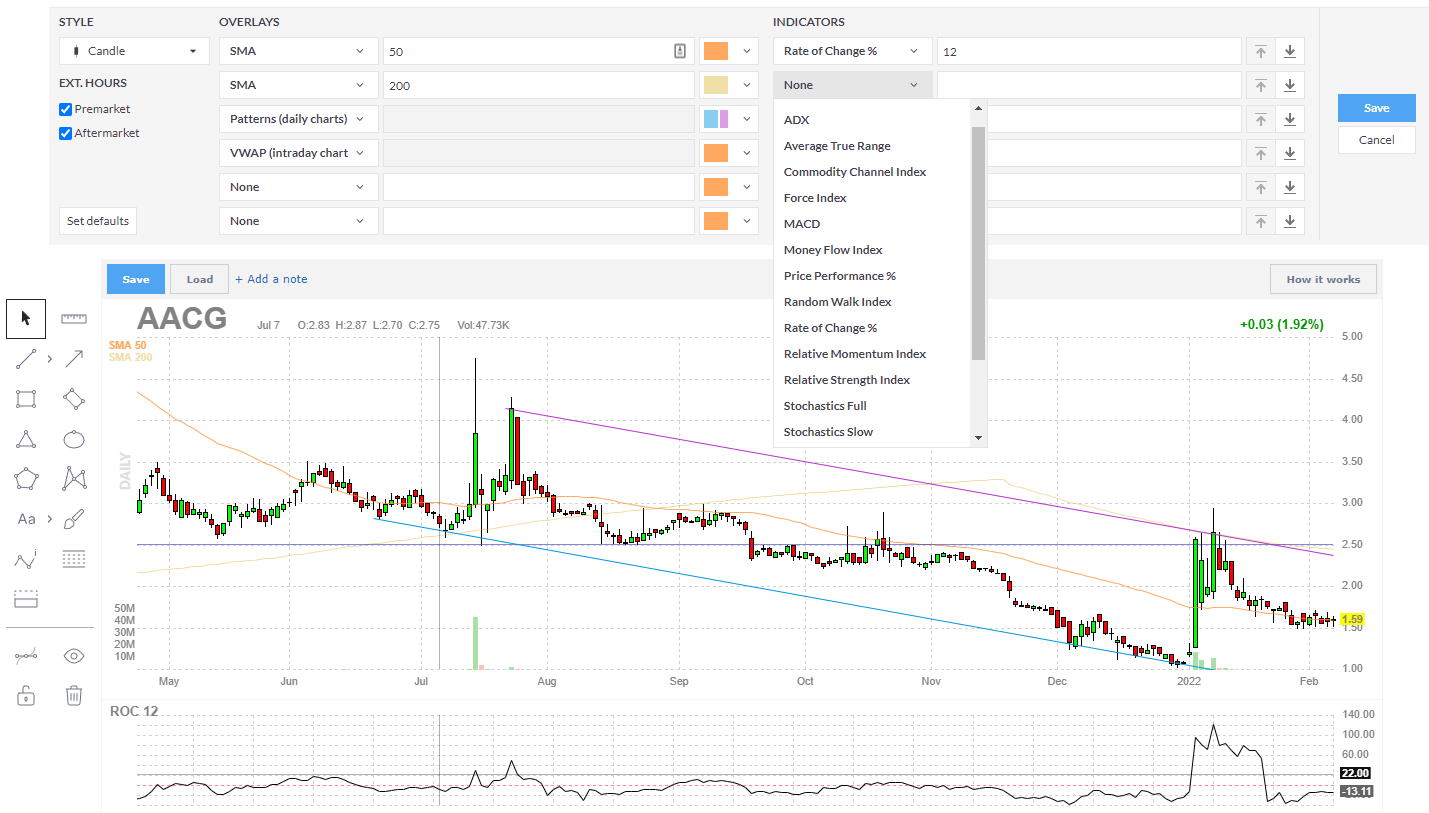
I find Finviz’s charting capabilities to be lacking. It only offers nine chart overlays and 17 indicators, which is quite limited compared to other platforms. The user experience is clunky and outdated. I can’t simply right-click to add an indicator. Instead, I have to open settings, make my selection, and then save.
A major frustration with Finviz is the constant need to click ‘save.’ There’s no auto-save feature for:
- Screening criteria
- Chart annotations
- Backtests
If I accidentally move to another chart, I lose my settings. This feels very old-fashioned and can be a real time-waster.
Backtesting
Backtesting is a crucial tool for traders and investors. It lets us test trading strategies using historical data. I’ve found it invaluable for fine-tuning my approach and boosting my confidence in new methods.
Finviz Backtesting
The service has over 100 indicators and can spot chart patterns automatically. This sounds good on paper, but the results leave much to be desired. I tested a strategy based on the Money Flow Index. It beat the S&P 500 over 24 years, with a 1,588% profit and 15.24% annual return. In comparison, the S&P 500 managed only 10.86%.
Here’s what bugs me about Finviz’s backtesting:
- Poor reporting
- No trade details
- Lack of buy/sell signals
- No info on drawdowns or win/loss ratios
Stock Rover shines in this area. It provides 10 years of financial data and robust scanning options. I’ve used it to test my “Beat the Market Strategy” with great success.
Stock Rover’s backtesting is:
- Flexible
- Intuitive
- Detailed in reporting
Research
I’ve found Stock Rover to be super for in-depth stock research. Its Research Reports feature stands out, offering real-time, professional-grade PDF reports on any stock’s performance. This tool transforms raw numbers into valuable insights.
The reports cover a company’s competitive stance, market position, and historical and potential returns. I particularly value their inclusion of dividend-adjusted commentary.
They’re always up-to-date, ensuring I have the latest information at my fingertips. The reports cover over 10,000 stocks on US and Canadian exchanges, giving me a wide range of options to research.
I find the ability to view reports in the browser or download them as PDFs incredibly useful. The summaries include key financial metrics, historical data, and market analysis, making Stock Rover an essential tool for my investment strategy.

What sets these reports apart is their real-time nature. They’re always up-to-date, ensuring I have the latest information at my fingertips. The reports cover over 10,000 stocks on US and Canadian exchanges, giving me a wide range of options to research.
I find the ability to view reports in the browser or download them as PDFs incredibly useful. This feature allows me to share my research or review it offline easily. The comprehensive summaries include key financial metrics, historical data, and market analysis, making Stock Rover an essential tool for my investment strategy.
Usability
Stock Rover stands out when it comes to usability. I find its interface modern and user-friendly, making it a breeze to navigate. The seamless integration of different components like screening, portfolio management, and charting is a big plus.
Finviz is user-friendly but features an outdated interface that feels somewhat antiquated. Its tools lack seamless integration compared to Stock Rover, which can lead to a less efficient workflow.
Both platforms are web-based, so you don’t need to install anything. This is great for quick access from any device. Finviz shines in data visualization, making it easy to grasp complex financial info at a glance. Its screener is also straightforward to use.
Stock Rover takes the lead in creating a more cohesive experience. All its features work together seamlessly, which I think is a big advantage for serious investors.
Final Thoughts
I’ve found Stock Rover to be the stronger choice for most investors. It outperforms Finviz in key areas like screening, backtesting, and portfolio management, and the research tools are also more robust.
Finviz still has its place, though. It’s a solid option if you need a simple, free screening tool.
Other Head-to-Head Tools Comparisons & Tests
- Finviz vs. Stock Rover: Comparing Top Stock Screening Tools.
- TradingView vs. TC2000: 32 Features Tested & Rated
- Finviz vs TradingView: Which One Makes You a Better Trader?
- TradingView vs StockCharts: My Test Results Will Shock You.
- TradingView vs. TrendSpider: 68 Point Test Decides The Best
- Read the full TradingView Review.
- Read the in-depth TC2000 review.
- Check out the Finviz Review.
- Real-time news and advanced charting: MetaStock
- The Ultimate AI Trading Platform: TrendSpider
- AI-powered day trading: Trade Ideas
